

Question: he information contained in the table below shows the expected return and standard deviation for a risky asset and risk - free asset. Asset Expected
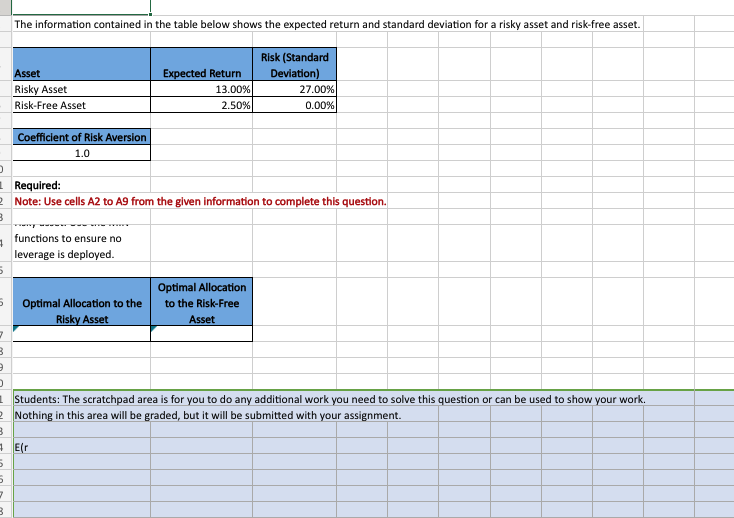
he information contained in the table below shows the expected return and standard deviation for a risky asset and riskfree asset.
Asset Expected Return Risk Standard Deviation
Risky Asset
RiskFree Asset
Coefficient of Risk Aversion
Required:
Using the information in the tables above, determine the optimal allocation to the risky asset. Use the MIN functions to ensure no leverage is deployed.
Step by Step Solution
There are 3 Steps involved in it
1 Expert Approved Answer
Step: 1 Unlock

Question Has Been Solved by an Expert!
Get step-by-step solutions from verified subject matter experts
Step: 2 Unlock
Step: 3 Unlock