

Question: Heading 2 Title Question 8. (5 points) Consider the following time series data. Month 1 2 3 4 Time Series Value 24 13 20 12
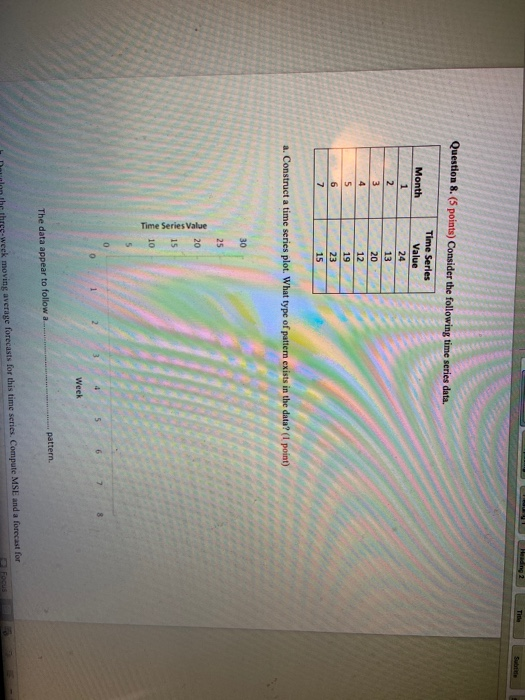


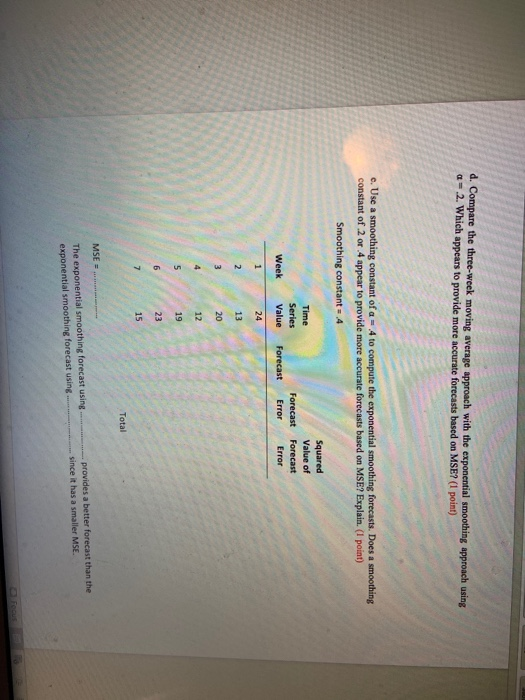
Heading 2 Title Question 8. (5 points) Consider the following time series data. Month 1 2 3 4 Time Series Value 24 13 20 12 19 23 15 5 6 7 a. Construct a time series plot. What type of patter exists in the data? (1 point) 30 25 20 Time Series Value 15 10 0 1 4 Week pattern The data appear to follow a SS-week moving average forecasts for this time series. Compute MSE and a forecast for Title b. Develop the three-week moving average forecasts for this time series. Compute MSE and a forecast for week 8. (1 point) Three-week moving average Time Squared Series Forecast Forecast Week Value Error Error Forecast 1 24 13 Page 11 of 16 3 20 4 12 5 19 6 23 7 15 Total MSE The forecast for week 8 = c. Use a - 2 to compute the exponential smoothing forecasts for the time series. Compute MSE and a forecast for week 8. (1 point) Smoothing constant = 2 Time Series Value Squared Forecast Error Forecast Error Week Forecast 1 24 13 2 3 4 20 12 5 19 6 23 7 15 Total MSE The forecast for week 8 - Page 12 of 16 d. Compare the three-week moving average approach with the exponential smoothing approach using a - 2. Which appears to provide more accurate forecasts based on MSE? (1 point) e. Use a smoothing constant of a = 4 to compute the exponential smoothing forecasts. Does a smoothing constant of 2 or 4 appear to provide more accurate forecasts based on MSE? Explain. (1 point) Smoothing constant = 4 Squared Time Value of Series Forecast Forecast Week Value Forecast Error Error 1 24 2 13 3 20 4 12 5 19 6 23 7 15 Total MSE = .......... The exponential smoothing forecast using exponential smoothing forecast using. provides a better forecast than the - since it has a smaller MSE
Step by Step Solution
There are 3 Steps involved in it

Get step-by-step solutions from verified subject matter experts