

Question: Hearing (% of words) Source List Error Total HO A researcher investigated four different word lists for use in hearing assessment. She wanted to
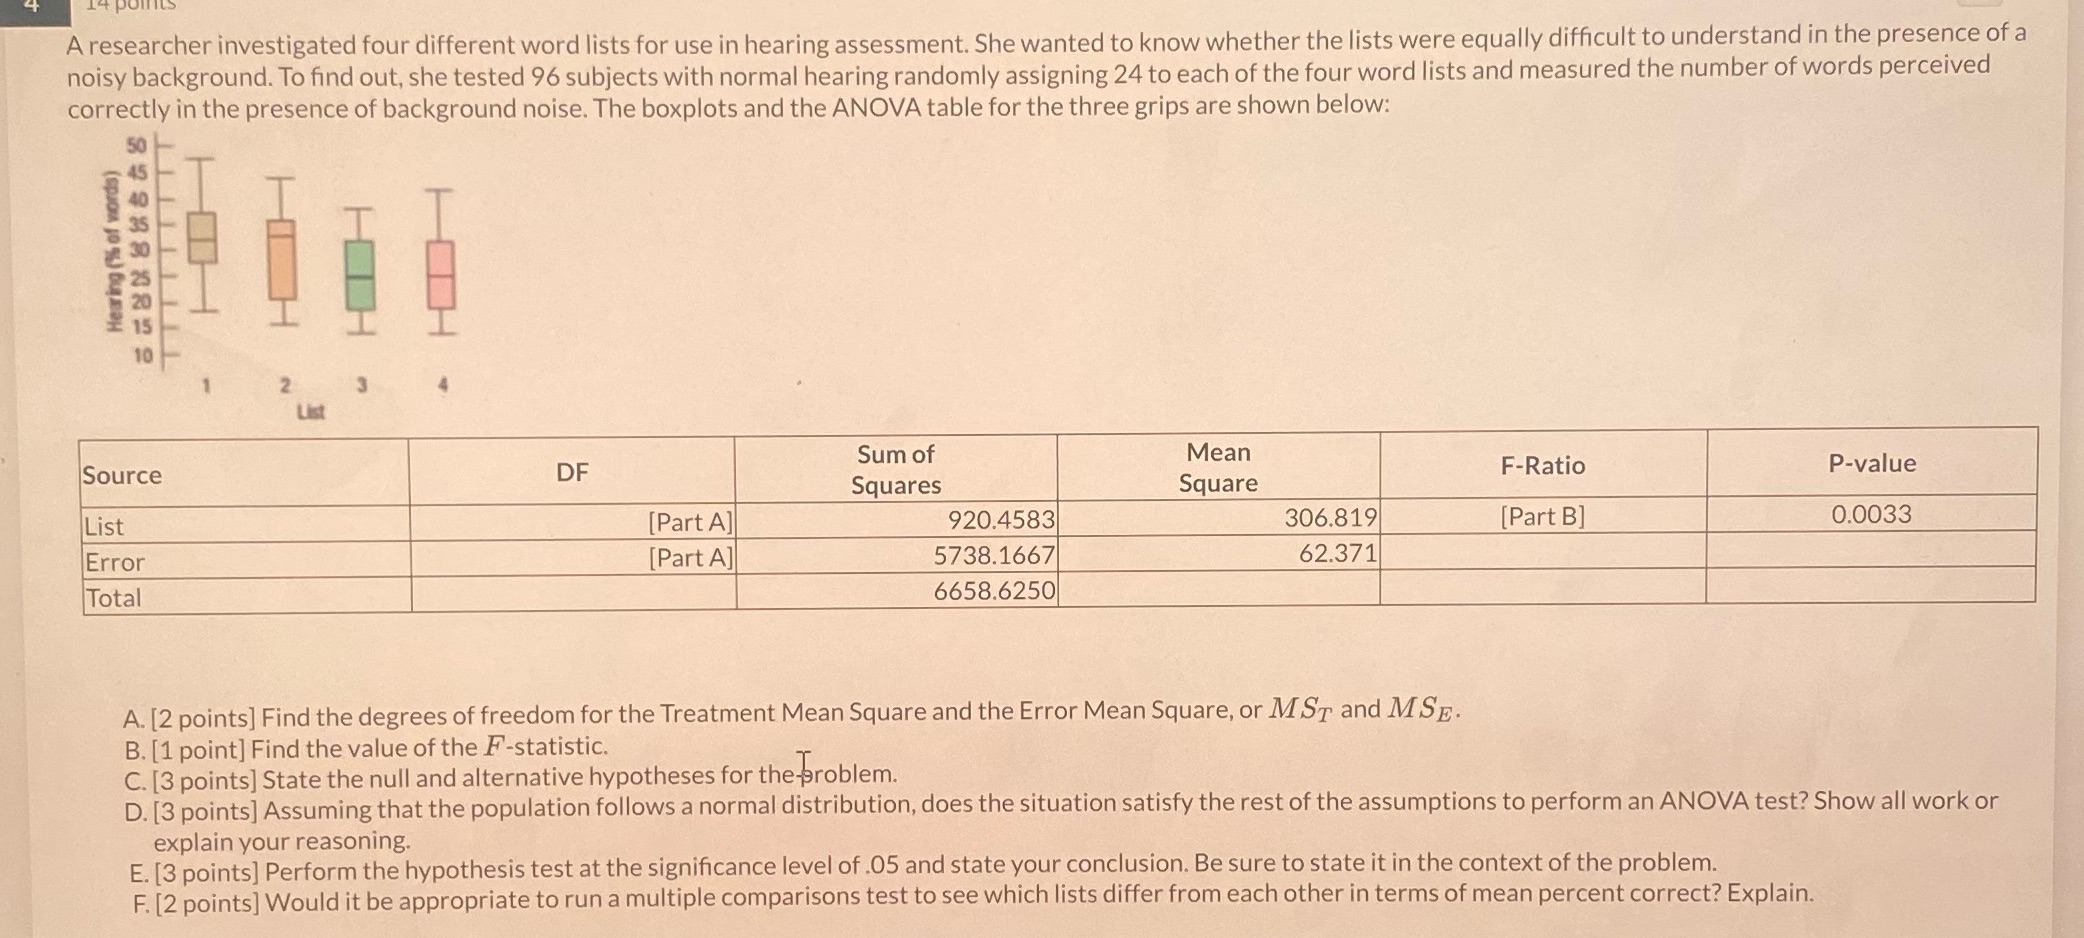
Hearing (% of words) Source List Error Total HO A researcher investigated four different word lists for use in hearing assessment. She wanted to know whether the lists were equally difficult to understand in the presence of a noisy background. To find out, she tested 96 subjects with normal hearing randomly assigning 24 to each of the four word lists and measured the number of words perceived correctly in the presence of background noise. The boxplots and the ANOVA table for the three grips are shown below: DF Sum of Squares Mean Square [Part A] [Part A] 920.4583 5738.1667 6658.6250 306.819 62.371 F-Ratio P-value [Part B] 0.0033 A. [2 points] Find the degrees of freedom for the Treatment Mean Square and the Error Mean Square, or MST and MSE. B. [1 point] Find the value of the F-statistic. C. [3 points] State the null and alternative hypotheses for the problem. D. [3 points] Assuming that the population follows a normal distribution, does the situation satisfy the rest of the assumptions to perform an ANOVA test? Show all work or explain your reasoning. E. [3 points] Perform the hypothesis test at the significance level of .05 and state your conclusion. Be sure to state it in the context of the problem. F. [2 points] Would it be appropriate to run a multiple comparisons test to see which lists differ from each other in terms of mean percent correct? Explain.
Step by Step Solution
There are 3 Steps involved in it

Get step-by-step solutions from verified subject matter experts