

Question: heducation.com/ext/map/index.html?_con=con&external_browser=0&launchUrl=https%253A%252F%252Fathens.blackboard.com%252Fwebapps%25 Assignment Chapter 13 Saved SUMMARY Groups Count Average Column 1 3 0.44 Column 2 3 1.46 Column 3 3 2. 67 Source of Variation
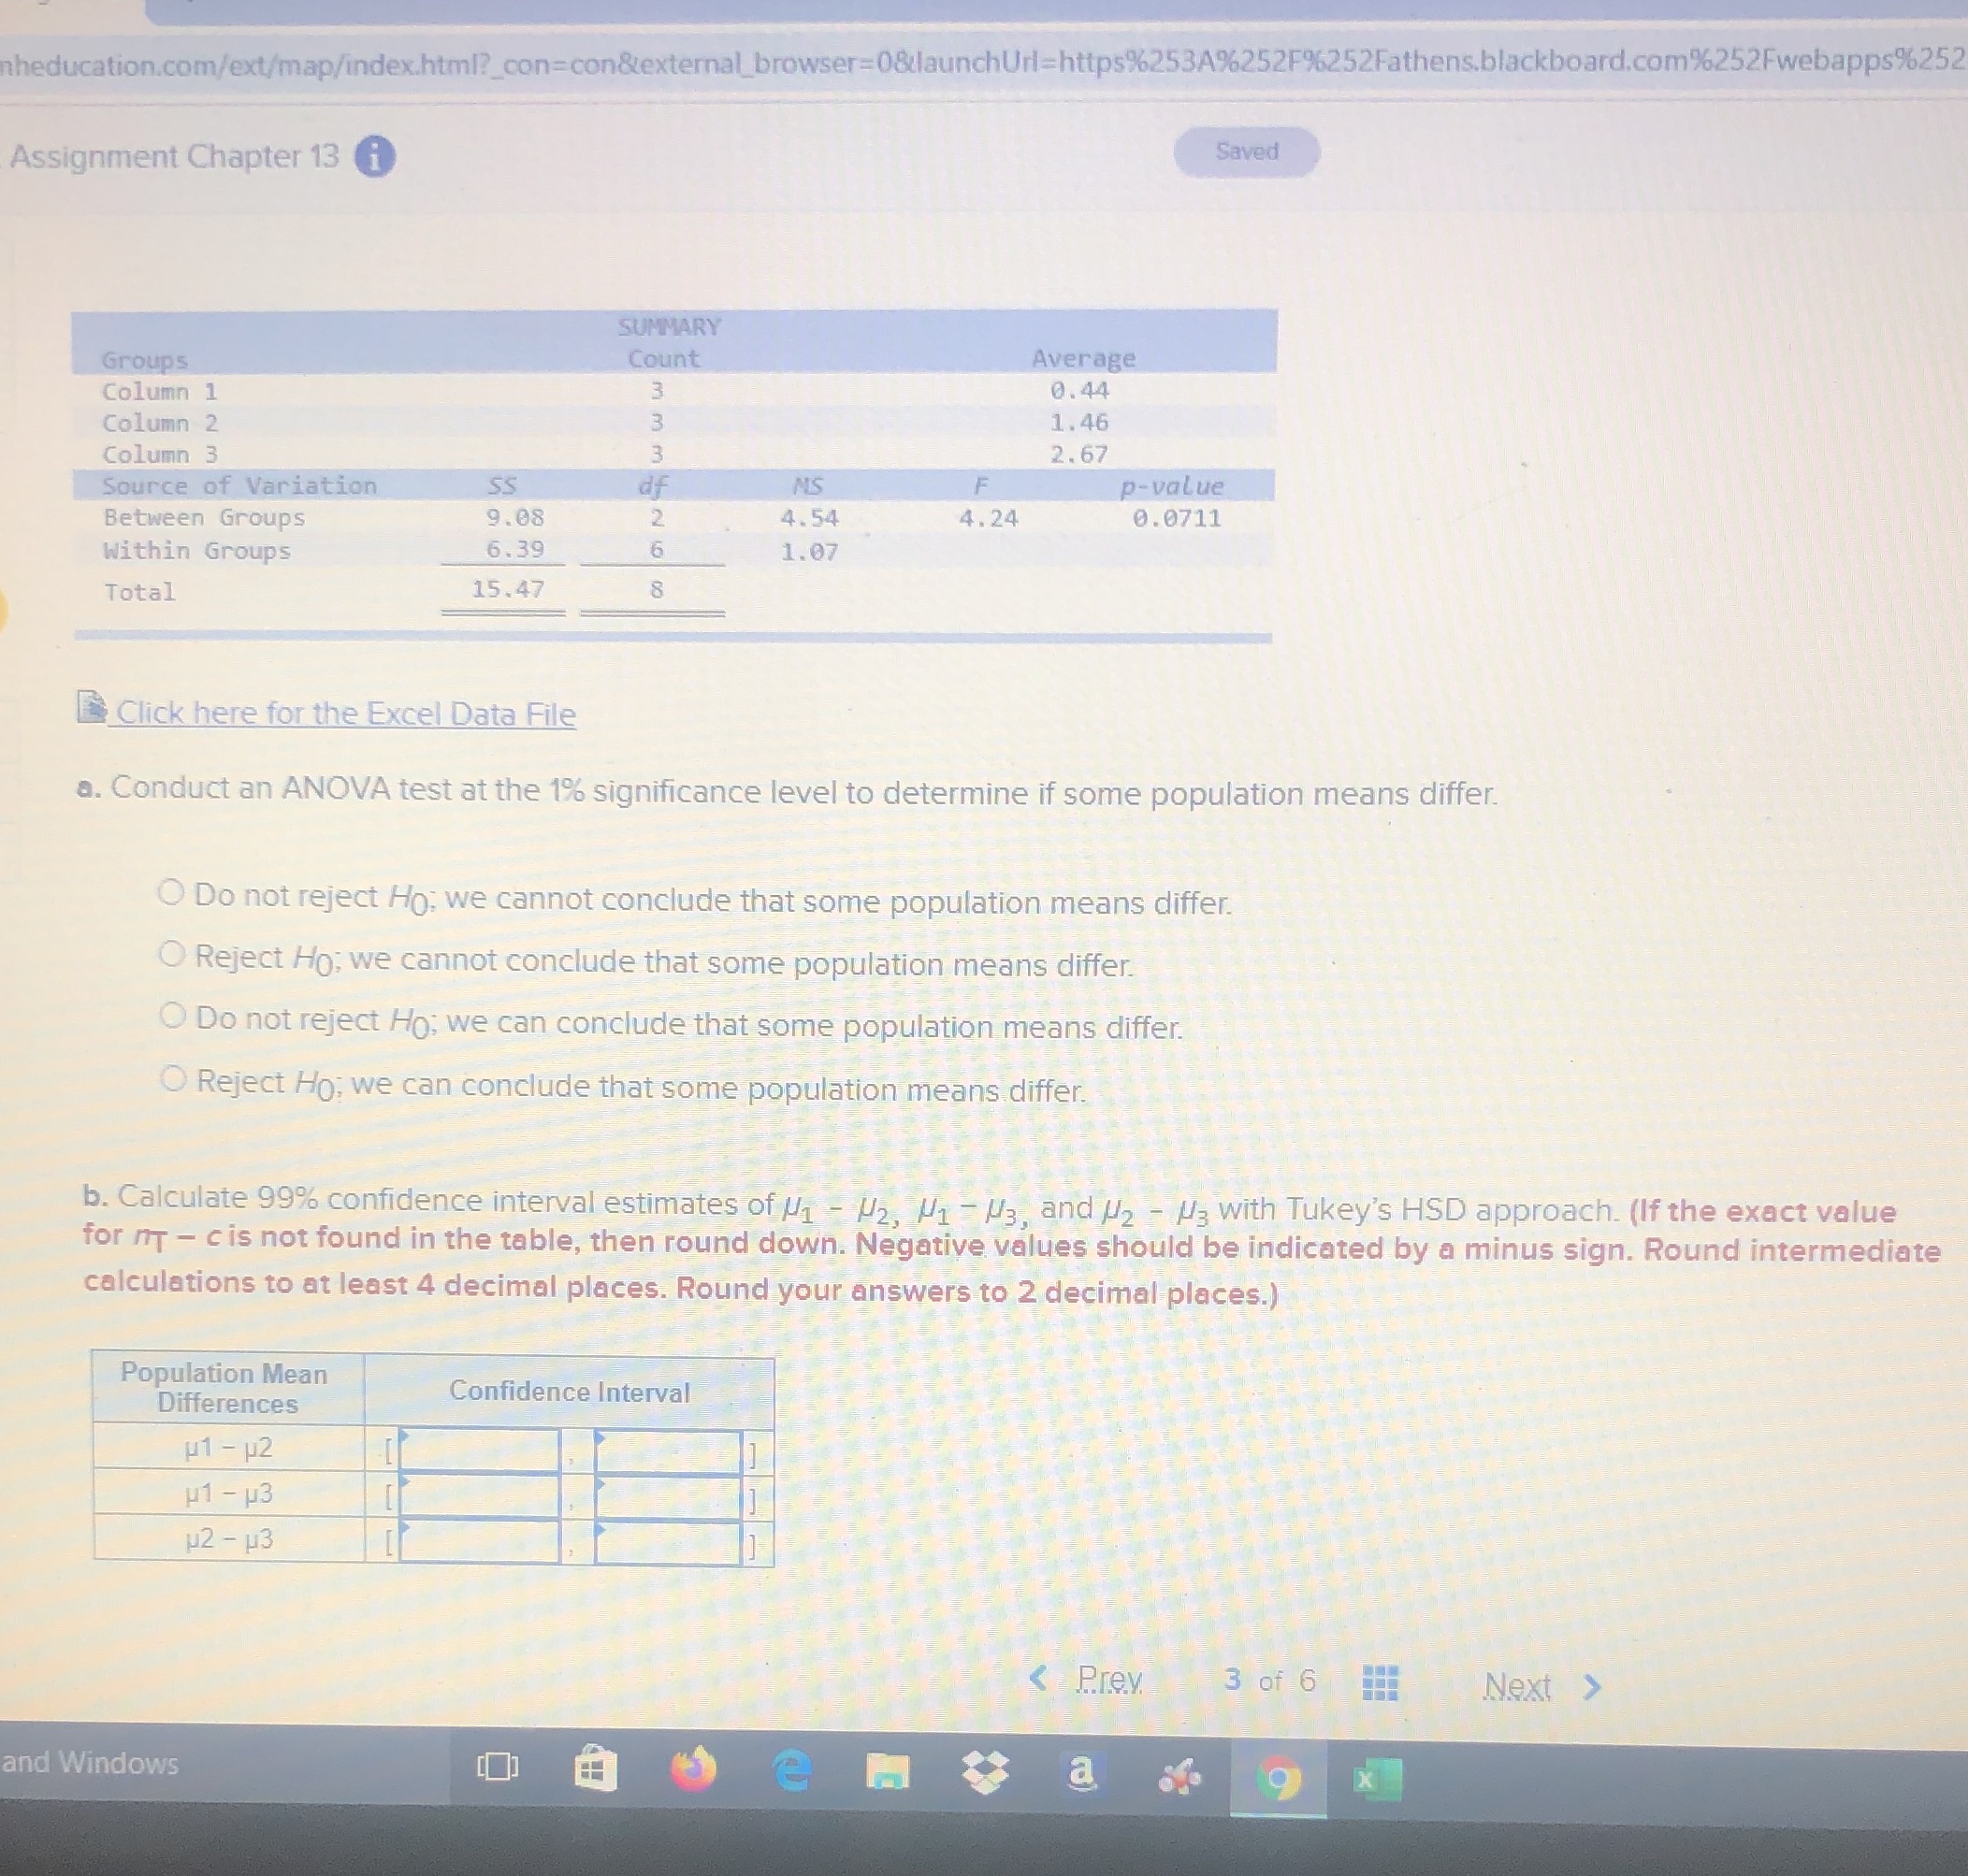
heducation.com/ext/map/index.html?_con=con&external_browser=0&launchUrl=https%253A%252F%252Fathens.blackboard.com%252Fwebapps%25 Assignment Chapter 13 Saved SUMMARY Groups Count Average Column 1 3 0.44 Column 2 3 1.46 Column 3 3 2. 67 Source of Variation SS of NS p-value Between Groups 9.08 2 4.54 4.24 0. 0711 Within Groups 6.39 1. 07 Total 15.47 8 Click here for the Excel Data File . Conduct an ANOVA test at the 1% significance level to determine if some population means differ. O Do not reject Ho: we cannot conclude that some population means differ. O Reject Ho; we cannot conclude that some population means differ. O Do not reject Ho; we can conclude that some population means differ. Reject Ho; we can conclude that some population means differ. b. Calculate 99% confidence interval estimates of MI - H2, M1 -M3, and U2 - /3 with Tukey's HSD approach. (If the exact value for AT - c is not found in the table, then round down. Negative values should be indicated by a minus sign. Round intermediate calculations to at least 4 decimal places. Round your answers to 2 decimal places.) Population Mean Differences Confidence Interval H1 - H2 H1 - H3 H2 - 13 and Windows a 9 X
Step by Step Solution
There are 3 Steps involved in it

Get step-by-step solutions from verified subject matter experts