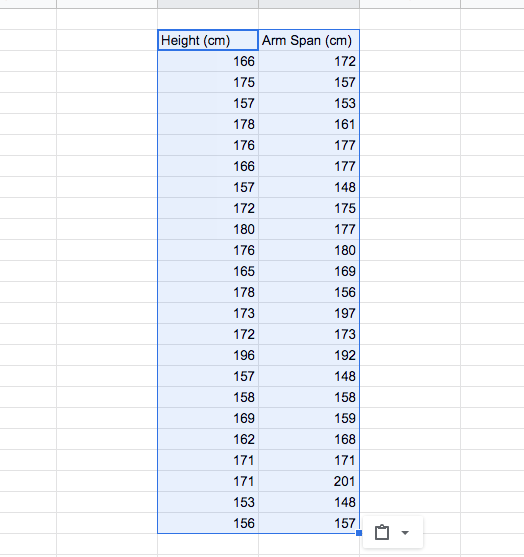
Height (cm) 166 175 157 178 176 166 157 172 180 176 165 178 173 172...
Fantastic news! We've Found the answer you've been seeking!
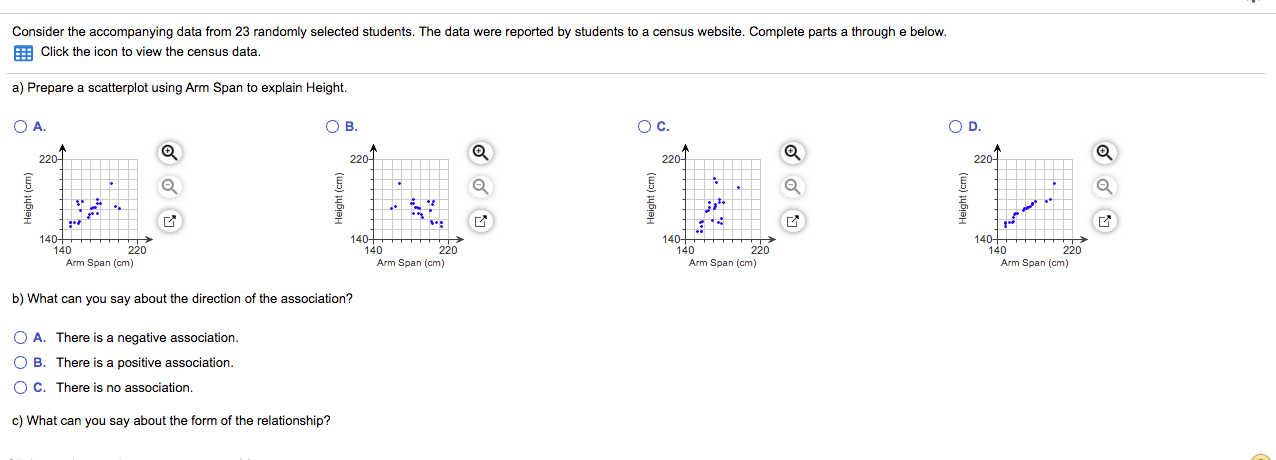
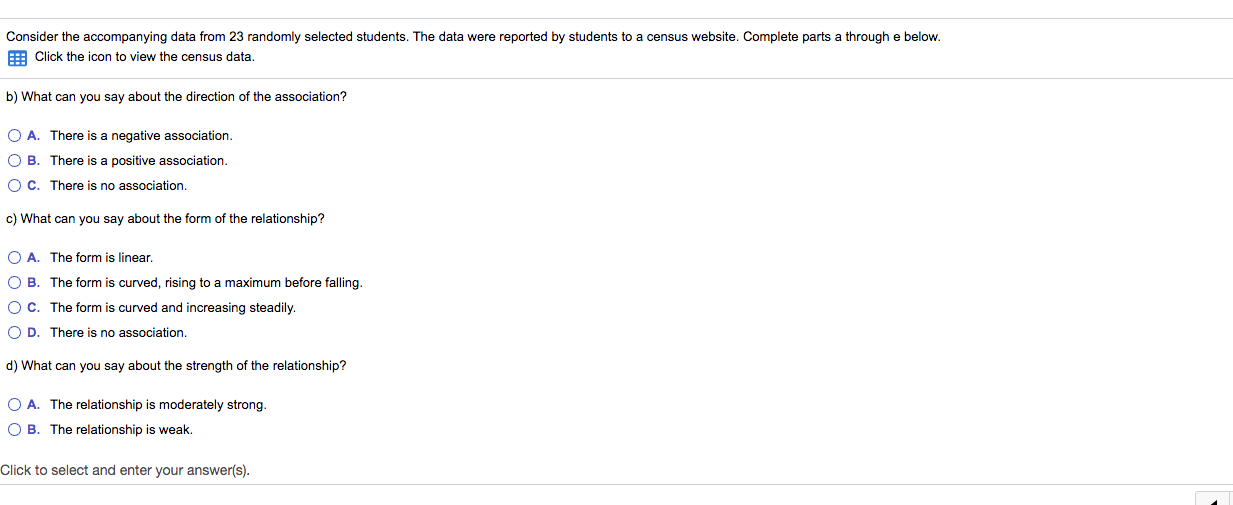
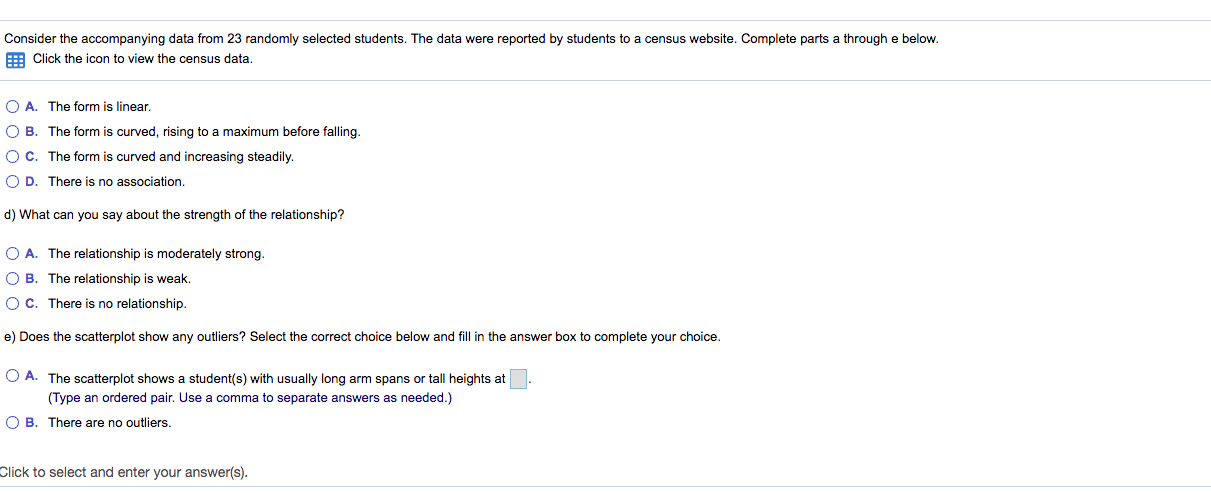
Question:
Transcribed Image Text:
Height (cm) 166 175 157 178 176 166 157 172 180 176 165 178 173 172 196 157 158 169 162 171 171 153 156 Arm Span (cm) 172 157 153 161 177 177 148 175 177 180 169 156 197 173 192 148 158 159 168 171 201 148 157 Consider the accompanying data from 23 randomly selected students. The data were reported by students to a census website. Complete parts a through e below. Click the icon to view the census data. a) Prepare a scatterplot using Arm Span to explain Height. O A. A Q 220- E 11 *** 140+ 140 220 Arm Span (cm) O B. Height (cm) c) What can you say about the form of the relationship? A 220- b) What can you say about the direction of the association? OA. There is a negative association. OB. There is a positive association. O C. There is no association. 140+ 140 .. BY W 220 Arm Span (cm) Q Q G O C. Height (cm) 220- 140+ 140 • → 220 Arm Span (cm) Q Q G O D. Height (cm) 220- Lov 140+ 140 Arm Span (cm) 220 7 Consider the accompanying data from 23 randomly selected students. The data were reported by students to a census website. Complete parts a through Click the icon to view the census data. b) What can you say about the direction of the association? O A. There is a negative association. O B. There is a positive association. O C. There is no association. c) What can you say about the form of the relationship? O A. The form is linear. O B. The form is curved, rising to a maximum before falling. OC. The form is curved and increasing steadily. O D. There is no association. d) What can you say about the strength of the relationship? O A. The relationship is moderately strong. O B. The relationship is weak. Click to select and enter your answer(s). below. Consider the accompanying data from 23 randomly selected students. The data were reported by students to a census website. Complete parts a through e below. Click the icon to view the census data. O A. The form is linear. O B. O C. O D. There is no association. d) What can you say about the strength of the relationship? The form is curved, rising to a maximum before falling. The form is curved and increasing steadily. O A. The relationship is moderately strong. O B. The relationship is weak. OC. There is no relationship. e) Does the scatterplot show any outliers? Select the correct choice below and fill in the answer box to complete your choice. O A. The scatterplot shows a student(s) with usually long arm spans or tall heights at (Type an ordered pair. Use a comma to separate answers as needed.) OB. There are no outliers. Click to select and enter your answer(s). Height (cm) 166 175 157 178 176 166 157 172 180 176 165 178 173 172 196 157 158 169 162 171 171 153 156 Arm Span (cm) 172 157 153 161 177 177 148 175 177 180 169 156 197 173 192 148 158 159 168 171 201 148 157 Consider the accompanying data from 23 randomly selected students. The data were reported by students to a census website. Complete parts a through e below. Click the icon to view the census data. a) Prepare a scatterplot using Arm Span to explain Height. O A. A Q 220- E 11 *** 140+ 140 220 Arm Span (cm) O B. Height (cm) c) What can you say about the form of the relationship? A 220- b) What can you say about the direction of the association? OA. There is a negative association. OB. There is a positive association. O C. There is no association. 140+ 140 .. BY W 220 Arm Span (cm) Q Q G O C. Height (cm) 220- 140+ 140 • → 220 Arm Span (cm) Q Q G O D. Height (cm) 220- Lov 140+ 140 Arm Span (cm) 220 7 Consider the accompanying data from 23 randomly selected students. The data were reported by students to a census website. Complete parts a through Click the icon to view the census data. b) What can you say about the direction of the association? O A. There is a negative association. O B. There is a positive association. O C. There is no association. c) What can you say about the form of the relationship? O A. The form is linear. O B. The form is curved, rising to a maximum before falling. OC. The form is curved and increasing steadily. O D. There is no association. d) What can you say about the strength of the relationship? O A. The relationship is moderately strong. O B. The relationship is weak. Click to select and enter your answer(s). below. Consider the accompanying data from 23 randomly selected students. The data were reported by students to a census website. Complete parts a through e below. Click the icon to view the census data. O A. The form is linear. O B. O C. O D. There is no association. d) What can you say about the strength of the relationship? The form is curved, rising to a maximum before falling. The form is curved and increasing steadily. O A. The relationship is moderately strong. O B. The relationship is weak. OC. There is no relationship. e) Does the scatterplot show any outliers? Select the correct choice below and fill in the answer box to complete your choice. O A. The scatterplot shows a student(s) with usually long arm spans or tall heights at (Type an ordered pair. Use a comma to separate answers as needed.) OB. There are no outliers. Click to select and enter your answer(s).
Expert Answer:
Related Book For
Understanding Basic Statistics
ISBN: 9781111827021
6th Edition
Authors: Charles Henry Brase, Corrinne Pellillo Brase
Posted Date:
Students also viewed these mathematics questions
-
What can you say about the series (an in each of the following cases? (a) (b) (c) an+1 lim an+1 amt, I = 0.8 lim a 11-08 ina an+1 itan
-
From the data in Table 15.2, what can you say in general about the ratio of saturated to unsaturated acids in fats and oils?
-
A source of light is monochromatic. What can you say about the photons emitted by this source?
-
Q6) From the product_t table, return the number of rows of products with a natural ash finish OR a cherry finish Q7) From the customer_t table, return all entries with a postal code beginning with 9,...
-
Discuss the advantages and disadvantages of the following forms of managerial compensation in terms of mitigating agency problems, that is, potential conflicts of interest between managers and...
-
The table displays the observed and expected cell counts and the standardized residuals for testing independence of happiness and family income, for GSS data. a. How would you interpret the...
-
Under what circumstances should a party be joined in an action?
-
Howe and Duleys company is organized as a partnership. At the prior year- end, partnership equity totaled $150,000 ($100,000 from Howe and $50,000 from Duley). For the current year, partnership net...
-
The current spot rate is USD 1.00 / EUR and the 6-month forward is USD 1.20 /EUR. You go long (you will purchase) EUR 1,000 forward. At maturity, the spot exchange rates is USD 1.10 / EUR. How much...
-
In the Reddy Mikks model of Example 2.2-1; (a) Determine the range for the ratio of the unit revenue of exterior paint to the unit revenue of interior paint. (b) If the revenue per ton of exterior...
-
The following table provides monthly sales ($1000) at a college bookstore. The sales show a seasonal pattern, with the greatest number when the college is in session and decrease during the summer...
-
You are the U.S residents who are going to pay SF 5,000 for your family flight tickets to Switzerland in 3 months later. The 3-month forward rate is $0.63/SF. Today, the spot rate of USD to Swiss...
-
Find the product and simplify your answer. (cos -1)(cos +1) (cos -1)(cos +1)=
-
2- A taxpayer disposed of an equipment used in one's trade or business at FMV of $100. The equipment was purchased at $100 and took depreciations of $40 prior to the disposition.Determine the tax...
-
You work for Wonder Treats, an online company that sells cookies, cupcakes, and other treats for parties. After making purchases online, customers receive their order by one-day mail. Today, you...
-
A division of a company produces income tax apps for smartphones. Each income tax app sells for $ 8 . The monthly fixed costs incurred by the division are $ 2 0 , 0 0 0 , and the variable cost of...
-
Discuss the stability of different conformations of n-butane (use Newman projections) with the help of their energy level diagram.
-
2. In the circuit given in Figure 2, i,(t) = 5.67cos(5t)A and v (t) = 70.71 cos(5t 60) V a) Find the equivalent load impedance. State whether the load is inductive or capacitive. b) Calculate the...
-
How hard is it to reach a businessperson by phone? Let p be the proportion of calls to businesspeople for which the caller reaches the person being called on the first try. (a) If you have no...
-
How do college professors spend their time? The National Education Association Almanac of Higher Education gives the following average distribution of professional time allocation: teaching, 51%;...
-
The accuracy of a census report on a city in southern California was questioned by some government officials. A random sample of 1215 people living in the city was used to check the report, and the...
-
Fill in the Blank. The eigenvalues of an \(n\)-degree-of-freedom system form a(n) _________ in the \(n\)-dimensional space.
-
Fill in the Blank. Any set of \(n\) linearly independent vectors in an \(n\)-dimensional space is called a(n) _________.
-
Fill in the Blank. The symmetry of stiffness and flexibility matrices is due to the _________ reciprocity theorem.
Study smarter with the SolutionInn App