

Question: Height Count Height Count 60 69 61 70 62 71 8 63 72 9 64 73 65 74 HAND 66 75 67 76 68 a)
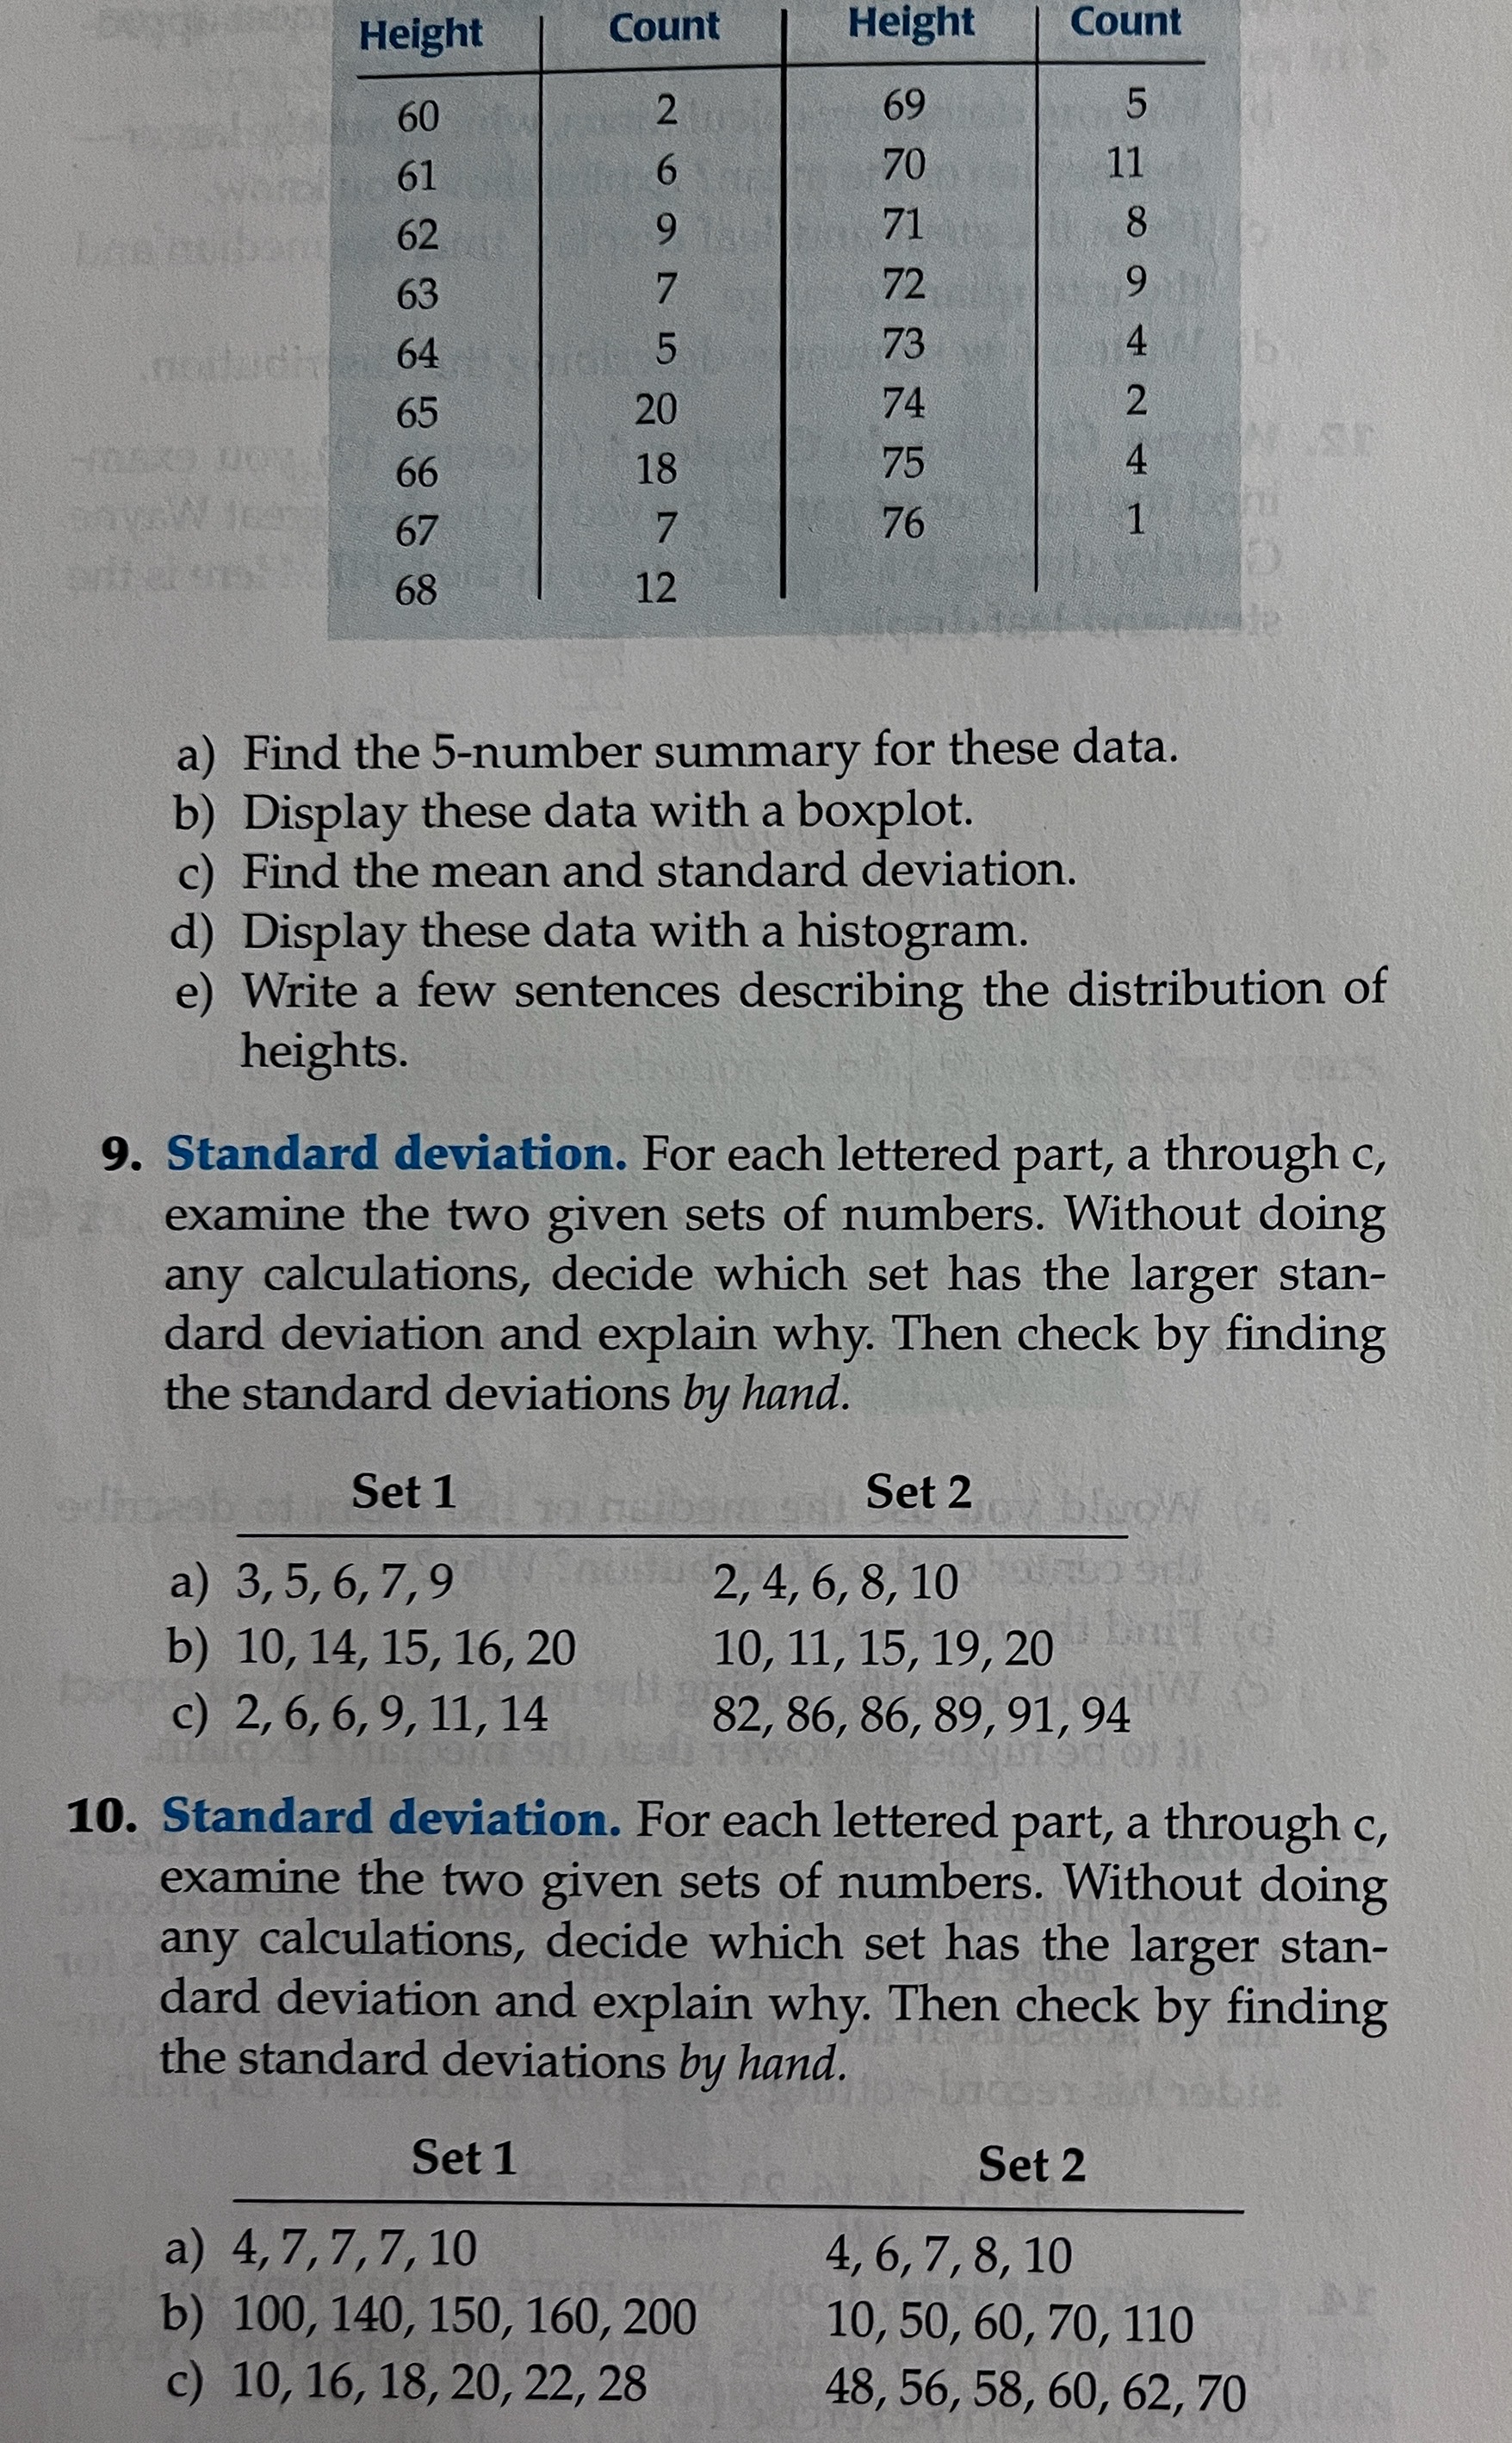
Height Count Height Count 60 69 61 70 62 71 8 63 72 9 64 73 65 74 HAND 66 75 67 76 68 a) Find the 5-number summary for these data. b) Display these data with a boxplot. c) Find the mean and standard deviation. d) Display these data with a histogram. e) Write a few sentences describing the distribution of heights. 9. Standard deviation. For each lettered part, a through c, examine the two given sets of numbers. Without doing any calculations, decide which set has the larger stan- dard deviation and explain why. Then check by finding the standard deviations by hand. Set 1 Set 2 a) 3, 5, 6, 7, 9 2, 4, 6, 8, 10 b) 10, 14, 15, 16, 20 10, 11, 15, 19, 20 c) 2, 6, 6, 9, 11, 14 82, 86, 86, 89, 91, 94 10. Standard deviation. For each lettered part, a through c, examine the two given sets of numbers. Without doing any calculations, decide which set has the larger stan- dard deviation and explain why. Then check by finding the standard deviations by hand. Set 1 Set 2 a) 4, 7, 7, 7, 10 4, 6, 7, 8, 10 b) 100, 140, 150, 160, 200 10, 50, 60, 70, 110 c) 10, 16, 18, 20, 22, 28 48, 56, 58, 60, 62, 70
Step by Step Solution
There are 3 Steps involved in it

Get step-by-step solutions from verified subject matter experts