

Question: Height vs Weight - Erroneous Data: You will need to use software to answer these questions. Below is the scatterplot and corresponding data for the
Height vs Weight - Erroneous Data:You will need to use software to answer these questions.
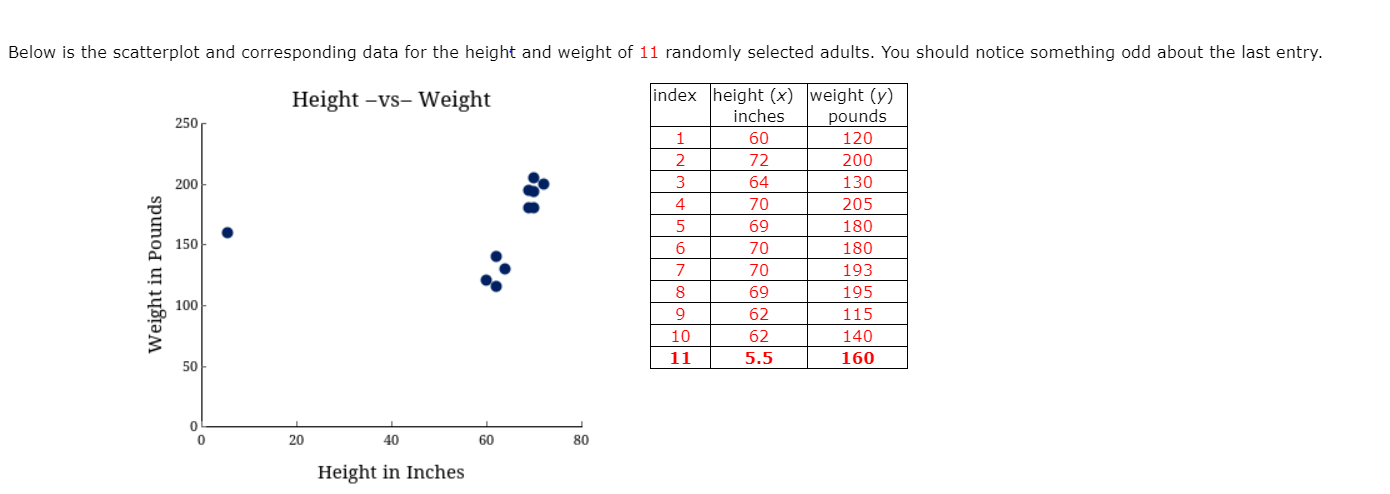
Below is the scatterplot and corresponding data for the height and weight of11randomly selected adults. You should notice something odd about the last entry.indexheight (x)weight (y)inchespounds1601202722003641304702055691806701807701938691959621151062140115.5160
You should be able copy and paste the data by highlighting theentire table.
Answer the following questions regarding the relationship.
(a) Using all11data pairs for height and weight, calculate the slope andy-intercept of the regression line.Round the slope to 2 decimal places and they-intercept to 1 decimal place.
?=x+
(b) Using the regression equation from part (a), estimate the weight of a person who is70inches tall.Round your answer to one decimal place.
?=pounds
(c) Using only the first10data pairs for height and weight, calculate the slope andy-intercept of the regression line.Round the slope to 2 decimal places and they-intercept to 1 decimal place.
?=x+
(d) Using the regression equation from part (c), estimate the weight of a person who is70inches tall.Round your answer to one decimal place.
?=pounds
(e) Which statement(s) explain this situation?
The height for the last data pair must be an error.
The erroneous value from the last data pair drastically changed the regression equation.
Including the last data pair made the slope closer to zero.
The prediction from part (d) should be more accurate than the prediction from part (b).
All of these are valid statements.
\f
Step by Step Solution
There are 3 Steps involved in it

Get step-by-step solutions from verified subject matter experts