Question: Helen managed a major manufacturing facility that was devoted largely to producing millions of identical small metallic parts. While the parts produced were (intended to

Helen managed a major manufacturing facility that was devoted largely to producing millions of identical small metallic parts. While the parts produced were (intended to be) identical, the facility produced them by using hundreds of presses, of three different types (which we'll call types 1, 2, and 3). The rated production rates for machine types 1, 2, and 3 were 700, 200, and 155 parts per minute, respectively, but actual production rates varied. Helen felt that factors such as quality of input material, worn or "changed-out" dies, and dirty or poorly maintained presses would probably affect production.

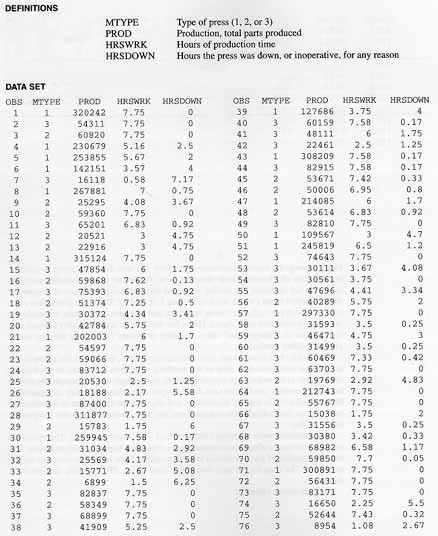
The facility had always kept daily production records, but from what Helen could tell, no one ever consulted them or did anything with them other than to put them in file cabinets at the end of each reporting period. She thought that in principle she should be able to monitor production rates for the types of machines, identify any machines that seemed to be in need of adjustment, and characterize the amount of downtime to be expected. Accordingly, she extracted one day's production records for 116 presses at her facility.

The machines were scheduled for a shift of 7.75 hours each day. The operators recorded the hours of operation manually on clipboards kept near each machine. The actual quantities of parts produced were determined from automatic counters on the machines. The data on the next two pages (and in file PROD) were derived from these logs.

Can you advise Helen?

Helen managed a major manufacturing facility that

DEFINITIONS MTYPE PROD HRSWRK HRSDOWN Type of press (1, 2, or 3) Production, total parts produced Hours of production time Hours the press was down, or inoperative, for any reason HRSWAK 7.75 7.75 7.75 5.16 5.67 3.57 0.56 7 4.0B 7.75 6.93 3 3 HRSDOWN 4 0.17 1.75 1.25 0.17 0.17 0.33 0.8 1.7 0.92 0 4.7 1.2 0 4.08 7.75 DATA SET OBS MTYPE 1 1 2 3 3 2 4 1 5 1 6 1 7 3 8 1 9 2 10 2 11 3 12 2 13 2 14 1 15 3 16 2 17 3 18 2 19 3 20 3 21 1 22 2 23 2 24 3 25 3 26 3 27 3 28 1 29 2 30 31 2 32 3 33 2 34 2 35 3 36 2 37 3 38 3 PROD 320242 54311 60820 230679 253855 142151 16118 267881 25295 59360 65201 20521 22916 315124 47854 59868 75393 51374 30372 42784 202003 54597 59066 83712 20530 18188 B7400 311877 15783 259945 31034 25569 15771 6899 82837 58349 68899 41909 6 7.62 6.83 7.25 4.34 5.75 6 7.75 7.75 7.75 2.5 2.17 7.75 7.75 1.75 7.54 4.83 4.17 2.67 1.5 7.75 7.75 7.75 5.25 HRSDOWN 0 0 0 2.5 2 4 7.17 0.75 3.67 0 0.92 4.75 4.75 0 1.75 0.13 0.92 0.5 3.41 2 1.7 0 0 0 1.25 5.58 0 0 6 0.17 2.92 3.58 5.08 6.25 OBS 39 40 41 42 43 44 45 46 47 48 49 50 51 52 53 54 55 56 57 58 59 60 61 62 63 64 65 66 67 68 69 70 71 72 73 74 75 76 MTYPE 1 3 3 3 1 3 2 2 1 2 3 1 1 3 3 3 3 2 1 3 3 3 3 3 2 1 2 3 3 3 3 2 1 2. 3 3 2 3 PROD 127686 60159 48111 22461 308209 82915 53671 50006 214085 53614 82810 109567 245819 74643 30111 30562 47696 40289 297330 31593 46471 31499 60469 63703 19769 212743 55767 15038 31556 30380 68982 59850 300891 56431 83171 16650 52644 8954 HRSWRK 3.75 7.58 6 2.5 7.58 7.58 7.42 6.95 6 6.83 7.75 3 6.5 7.75 3.67 3.75 4.41 5.75 7.75 3.5 4.75 3.5 7.33 7.75 2.92 7.75 7.75 1.75 3.5 3.42 6.58 7.7 7.75 7.75 7.75 2.25 7.43 1.08 3.34 2 0 0.25 3 0.25 0.42 0 4.83 0 0 2 0.25 0.33 1.17 0.05 0 O 0 5.5 0.32 2.67 OOO 2.5

Step by Step Solution

There are 3 Steps involved in it

1 Expert Approved Answer
Step: 1 Unlock blur-text-image
Question Has Been Solved by an Expert!

Get step-by-step solutions from verified subject matter experts

Step: 2 Unlock
Step: 3 Unlock

Students Have Also Explored These Related General Management Questions!