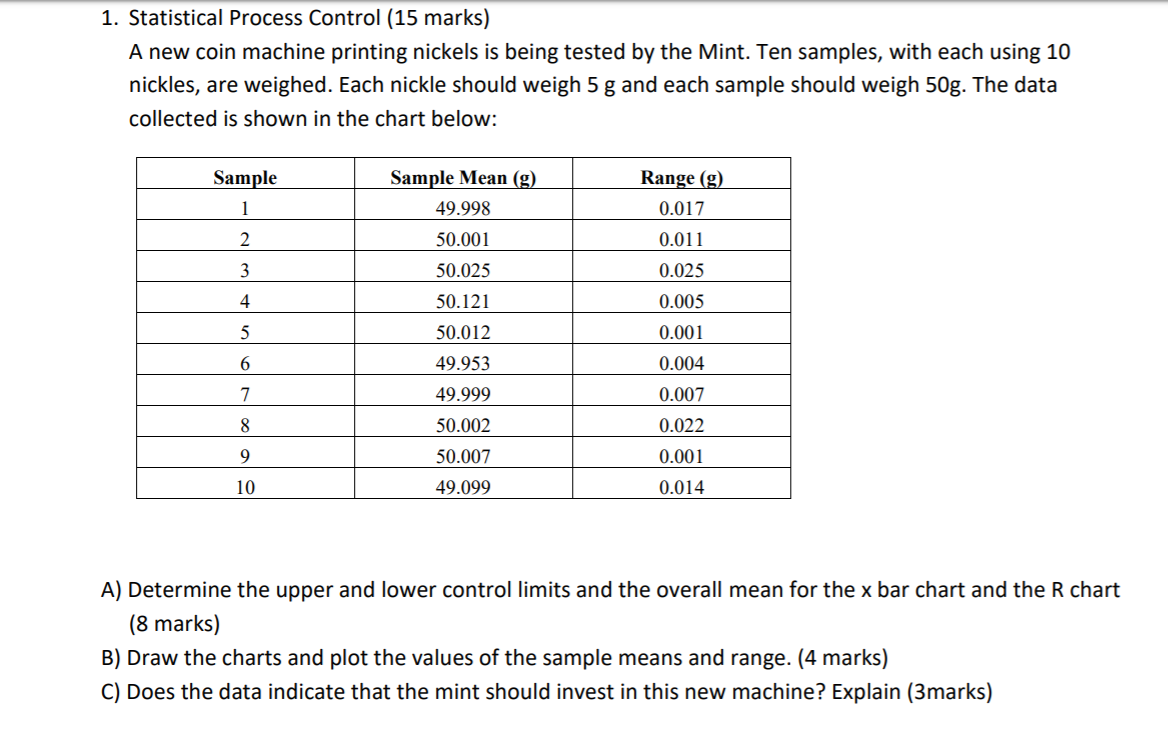
Question: Hello. Any help will be greatly appreciated. 1. Statistical Process Control (15 marks) A new coin machine printing nickels is being tested by the Mint.

Hello. Any help will be greatly appreciated.

Hello. Any help will be greatly appreciated. 1.

1. Statistical Process Control (15 marks) A new coin machine printing nickels is being tested by the Mint. Ten samples, with each using 10 nickles, are weighed. Each nickle should weigh 5 g and each sample should weigh 50g. The data collected is shown in the chart below: Sample Sample Mean (g) 49.998 50.001 Range (g) 0.017 2 0.011 3 50.025 0.025 4 50.121 0.005 5 50.012 0.001 6 49.953 0.004 7 0.007 8 49.999 50.002 50.007 0.022 0.001 9 10 49.099 0.014 A) Determine the upper and lower control limits and the overall mean for the x bar chart and the R chart (8 marks) B) Draw the charts and plot the values of the sample means and range. (4 marks) C) Does the data indicate that the mint should invest in this new machine? Explain (3marks)

Step by Step Solution

There are 3 Steps involved in it

1 Expert Approved Answer
Step: 1 Unlock blur-text-image
Question Has Been Solved by an Expert!

Get step-by-step solutions from verified subject matter experts

Step: 2 Unlock
Step: 3 Unlock

Students Have Also Explored These Related General Management Questions!