

Question: Hello, Can someone help: . Visualize the data in a scatter plot. What preliminary conclusions can you draw from this plot? 2. Run a simple
Hello, Can someone help:
. Visualize the data in a scatter plot. What preliminary conclusions can you draw from this
plot?
2. Run a simple linear regression of Quarterly Sales on Student Population in Excel.2
3. If Armand's Pizza opened a new restaurant next to a college with 10,000 students, what
would be the expected quarterly sales of this restaurant?
Write
down the estimated linear equation relating Quarterly Sales with Student Population
and draw the line through the scatter plot.
4. A colleague questions a linear relationship claiming that the variation in Quarterly Sales
is purely random. How can you address her concern?
5. How would you estimate the expected increase in quarterly sales per student?
6. Another colleague tells you that he believes that sales per quarter increase by no more
than $4.75 per additional student. Can you reject his claim?
7. Provide a 95% prediction interval for quarterly sales of a newly opened restaurant in
Rosemont, a city with 10,000 students.
8. Provide a 95% confidence interval for the average quarterly sales of all restaurants in
cities with 10,000 students.
9. What is the coefficient of correlation? What is R^2?
10. What assumptions are you making in your analysis?
11. Restaurants 2,4,8 and 10 are close to tourist locations that are generally known for
unusually high pizza demand. Introduce a dummy variable to account for this shifting
effect and rerun the linear regression. What is your estimate of the quarterly sales
generated by tourists?
I got answer for question 7, however, did not get it, could someone explain, where u got those numbers. it is the same for question 8.
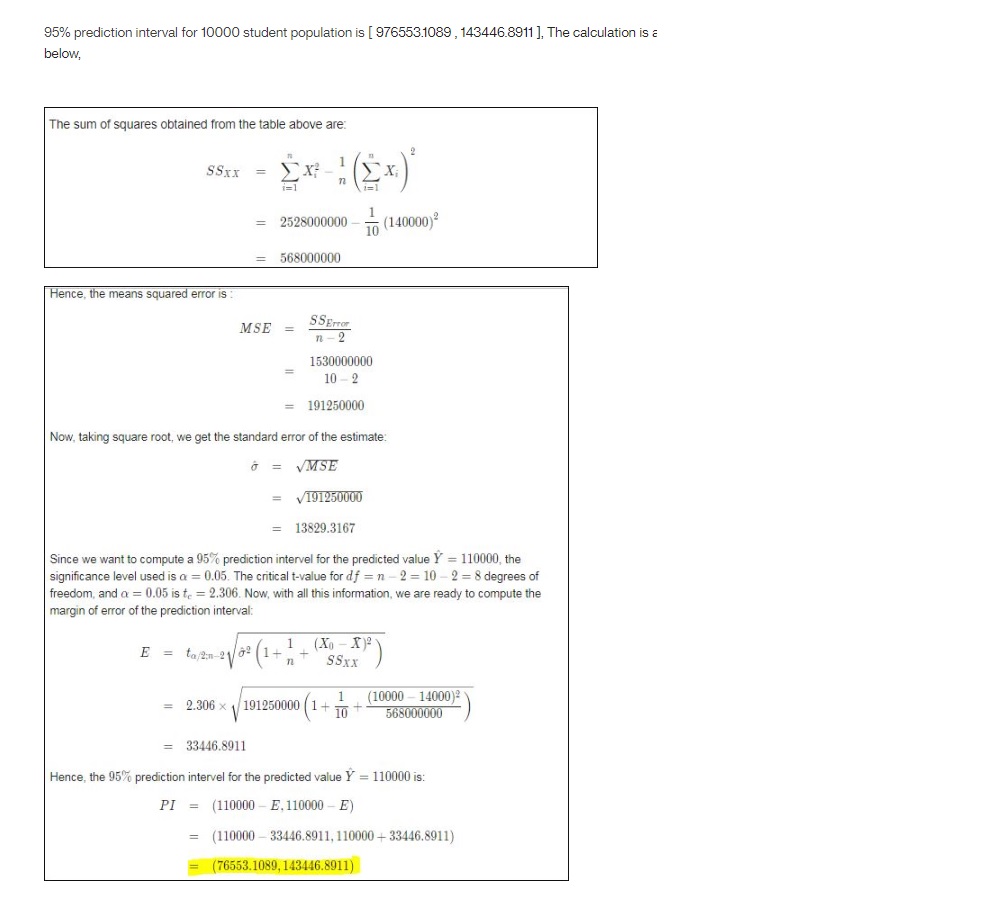
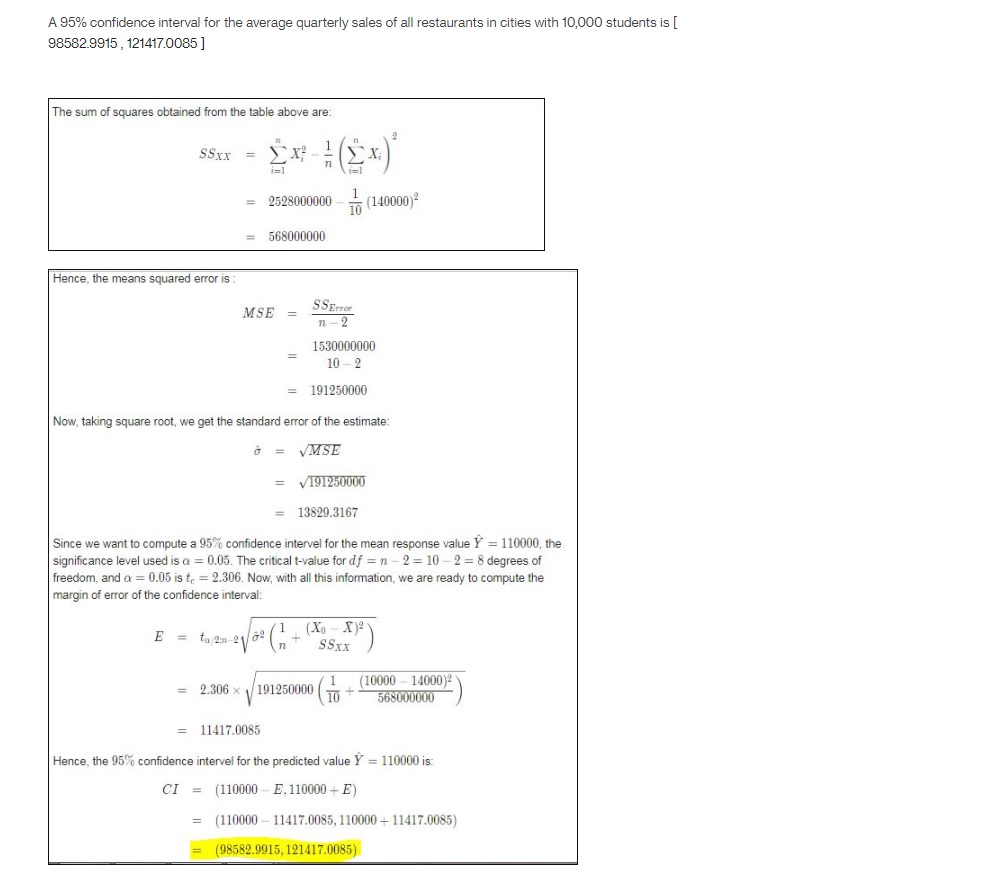
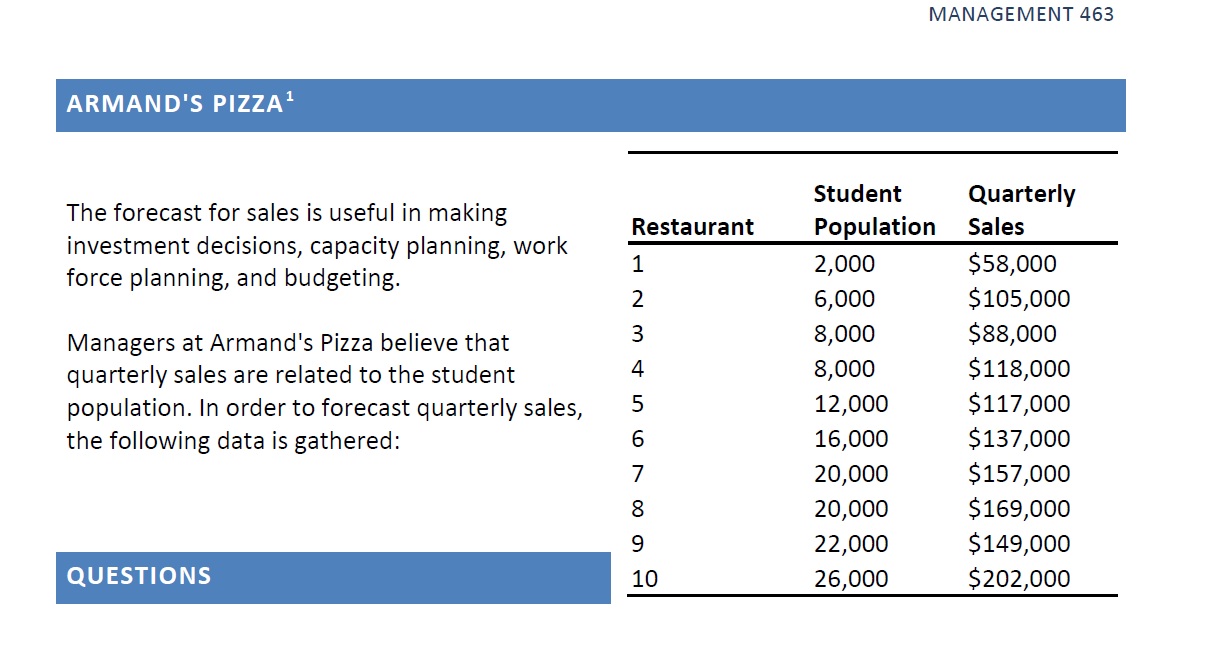
95% prediction interval for 10000 student population is [ 976553.1089 , 143446.8911], The calculation is a below, The sum of squares obtained from the table above are: SSXX = 2528000000 10 (140000)? 568000000 Hence, the means squared error is MSE = SSError n - 2 1530000000 10 - 2 191250000 Now, taking square root, we get the standard error of the estimate: 0 = VMSE = V191250000 = 13829.3167 Since we want to compute a 95%% prediction intervel for the predicted value Y = 110000, the significance level used is a = 0.05. The critical t-value for df = n - 2 = 10 -2 = 8 degrees of freedom, and a = 0.05 is to = 2.306. Now, with all this information, we are ready to compute the margin of error of the prediction interval: E = tojan 21/0? (1+1 + (No -x) SSxx = 2.306 x 191250000 (1+ 1 (10000 - 14000)? 10 568000000 33446.8911 Hence, the 95% prediction intervel for the predicted value Y = 110000 is: PI = (110000 - E, 110000 - E) = (110000 - 33446.8911, 110000 + 33446.8911) = (76553.1089, 143446.8911)A 95% confidence interval for the average quarterly sales of all restaurants in cities with 10,000 students is [ 98582.9915 , 121417.0085 ] The sum of squares obtained from the table above are: SSxx = Ex - 1=1 (Ex. ) 2528000000 10 (140000)? = 568000000 Hence, the means squared error is MSE = SSError n -2 1530000000 10 - 2 191250000 Now, taking square root, we get the standard error of the estimate: = VMSE = V191250000 13829.3167 Since we want to compute a 95% confidence intervel for the mean response value Y = 110000, the significance level used is a = 0.05. The critical t-value for df = n - 2 = 10 -2 = 8 degrees of freedom, and o = 0.05 is to = 2.306. Now, with all this information, we are ready to compute the margin of error of the confidence interval: E = talm 21/02 (1 + (No -X)2 SSxx = 2.306 x /191250000 70 (10000 - 14000)- 568000000 = 11417.0085 Hence, the 95% confidence intervel for the predicted value Y = 110000 is: CI = (110000 - E, 110000 + E) (110000 - 11417.0085, 110000 + 11417.0085) (98582.9915, 121417.0085)MANAGEMENT 463 ARMAND'S PIZZA1 _ _ _ Student Quarterly The forecast for sales Is useful In making . _ _ , _ _ Restaurant Population Sales Investment deCISIons, capaCIty planning, work 1 2 000 $58 000 force planning, and budgeting. ' ' 2 6,000 $105,000 Managers at Armand's Pizza believe that 3 81000 5881000 quarterly sales are related to the student 4 3.000 $118,000 population. In order to forecast quarterly sales, 5 12.000 $117,000 the following data is gathered: 6 16,000 $137,000 7 20,000 $157,000 8 20,000 $169,000 9 22,000 $149,000 QUESTIONS 10 26,000 $202,000
Step by Step Solution
There are 3 Steps involved in it

Get step-by-step solutions from verified subject matter experts