

Question: 1. Visualize the data in a scatter plot. What preliminary conclusions can you draw from this plot? 2. Run a simple linear regression of Quarterly
1. Visualize the data in a scatter plot. What preliminary conclusions can you draw from this
plot?
2. Run a simple linear regression of Quarterly Sales on Student Population in Excel.2
3. If Armand's Pizza opened a new restaurant next to a college with 10,000 students, what
would be the expected quarterly sales of this restaurant?
Write
down the estimated linear equation relating Quarterly Sales with Student Population
and draw the line through the scatter plot.
4. A colleague questions a linear relationship claiming that the variation in Quarterly Sales
is purely random. How can you address her concern?
5. How would you estimate the expected increase in quarterly sales per student?
6. Another colleague tells you that he believes that sales per quarter increase by no more
than $4.75 per additional student. Can you reject his claim?
7. Provide a 95% prediction interval for quarterly sales of a newly opened restaurant in
Rosemont, a city with 10,000 students.
8. Provide a 95% confidence interval for the average quarterly sales of all restaurants in
cities with 10,000 students.
9. What is the coefficient of correlation? What is R^
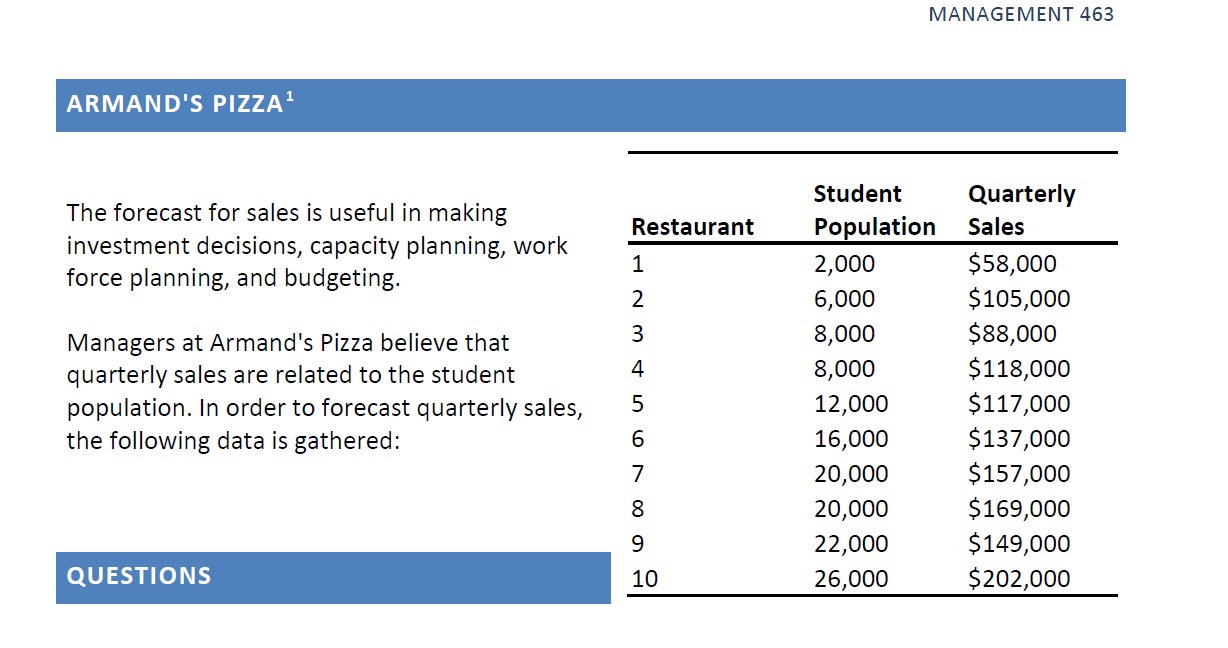
MANAGEMENT 463 ARMAND'S PIZZA1 _ _ _ Student Quarterly The forecast for sales Is useful In making . _ _ , _ _ Restaurant Population Sales Investment deCISIons, capaCIty planning, work 1 2 000 $58 000 force planning, and budgeting. ' ' 2 6,000 $105,000 Managers at Armand's Pizza believe that 3 81000 5881000 quarterly sales are related to the student 4 3.000 $118,000 population. In order to forecast quarterly sales, 5 12.000 $117,000 the following data is gathered: 6 16,000 $137,000 7 20,000 $157,000 8 20,000 $169,000 9 22,000 $149,000 QUESTIONS 10 26,000 $202,000
Step by Step Solution
There are 3 Steps involved in it

Get step-by-step solutions from verified subject matter experts