

Question: Hello can you help me complete these questions Use this data to complete the questions Question 1 Copy-paste the figure you created that shows a
Hello can you help me complete these questions Use this data to complete the questions
Question 1
Copy-paste the figure you created that shows a check for outliers in the ratings of all three pizza places into a word or Google document. Format this like you would for a paper and upload a screenshot, not the doc here that shows all of the formatting.
Just provide a screenshot
Question 2
Regarding the figure that checked for outliers, answer the following Was the assumption that there are no outliers met or violated?
?The assumption was met because there was at least one outlier found.
? The assumption was met because no outliers were found.
?The assumption was violated because no outliers were found.
? The assumption was violated because there was at least one outlier found.
Question 3 Copy-paste the figure showing the distribution of ratings for Papa John's into a Word or Google document. Format this like you would for a paper and upload a screenshot, not the doc here that shows all of the formatting.
Just provide a screenshot
Question 4
Copy-paste the figure showing the distribution of ratings for Pizza Hut into a Word or Google document. Format this like you would for a paper and upload a screenshot, not the doc here that shows all of the formatting.
Just provide a screenshot
Question 5 Copy-paste the figure showing the distribution of ratings for Mozzi's into a Word or Google document.
Format this like you would for a paper and upload a screenshot, not the doc here that shows all of the formatting.
Just provide a screenshot
Question 6 Now, remember, you should use the distributions to check normality, BUT since our sample size is small, they may not be good representations, so you must also use the skew and kurtosis statistics to ensure they are within the proper limits. With that information, what can we say about normality?
?The distributions and skewness/kurtosis statistic were within normal limits
?The distributions and skewness/kurtosis statistic were not within normal limits. The assumption was violated.
?The distributions and skewness/kurtosis statistic were not within normal limits. The assumption was met.
?The distributions and skewness/ kurtosis statistic were within normal limits.
The assumption was violated.
Question 7
Create the ANOVA table in a form within an MS Word or Google Doc and upload a screenshot, not the doc of that here. You will need to include: ? Source of Variation ? SS ? df ? MS ? F ? p-value (p should be lower-case) All should be rounded to two decimal places, except df is whole numbers.
Label this Table 1 One Way ANOVA of pizza place ratings. Remember, if SS, MS, or F are less than the absolute value of 1, you need to put a zero before the decimal point. However, you do not do this
with p-value. (e.g., F = 0.92, p = .34.)
Just provide a screenshot
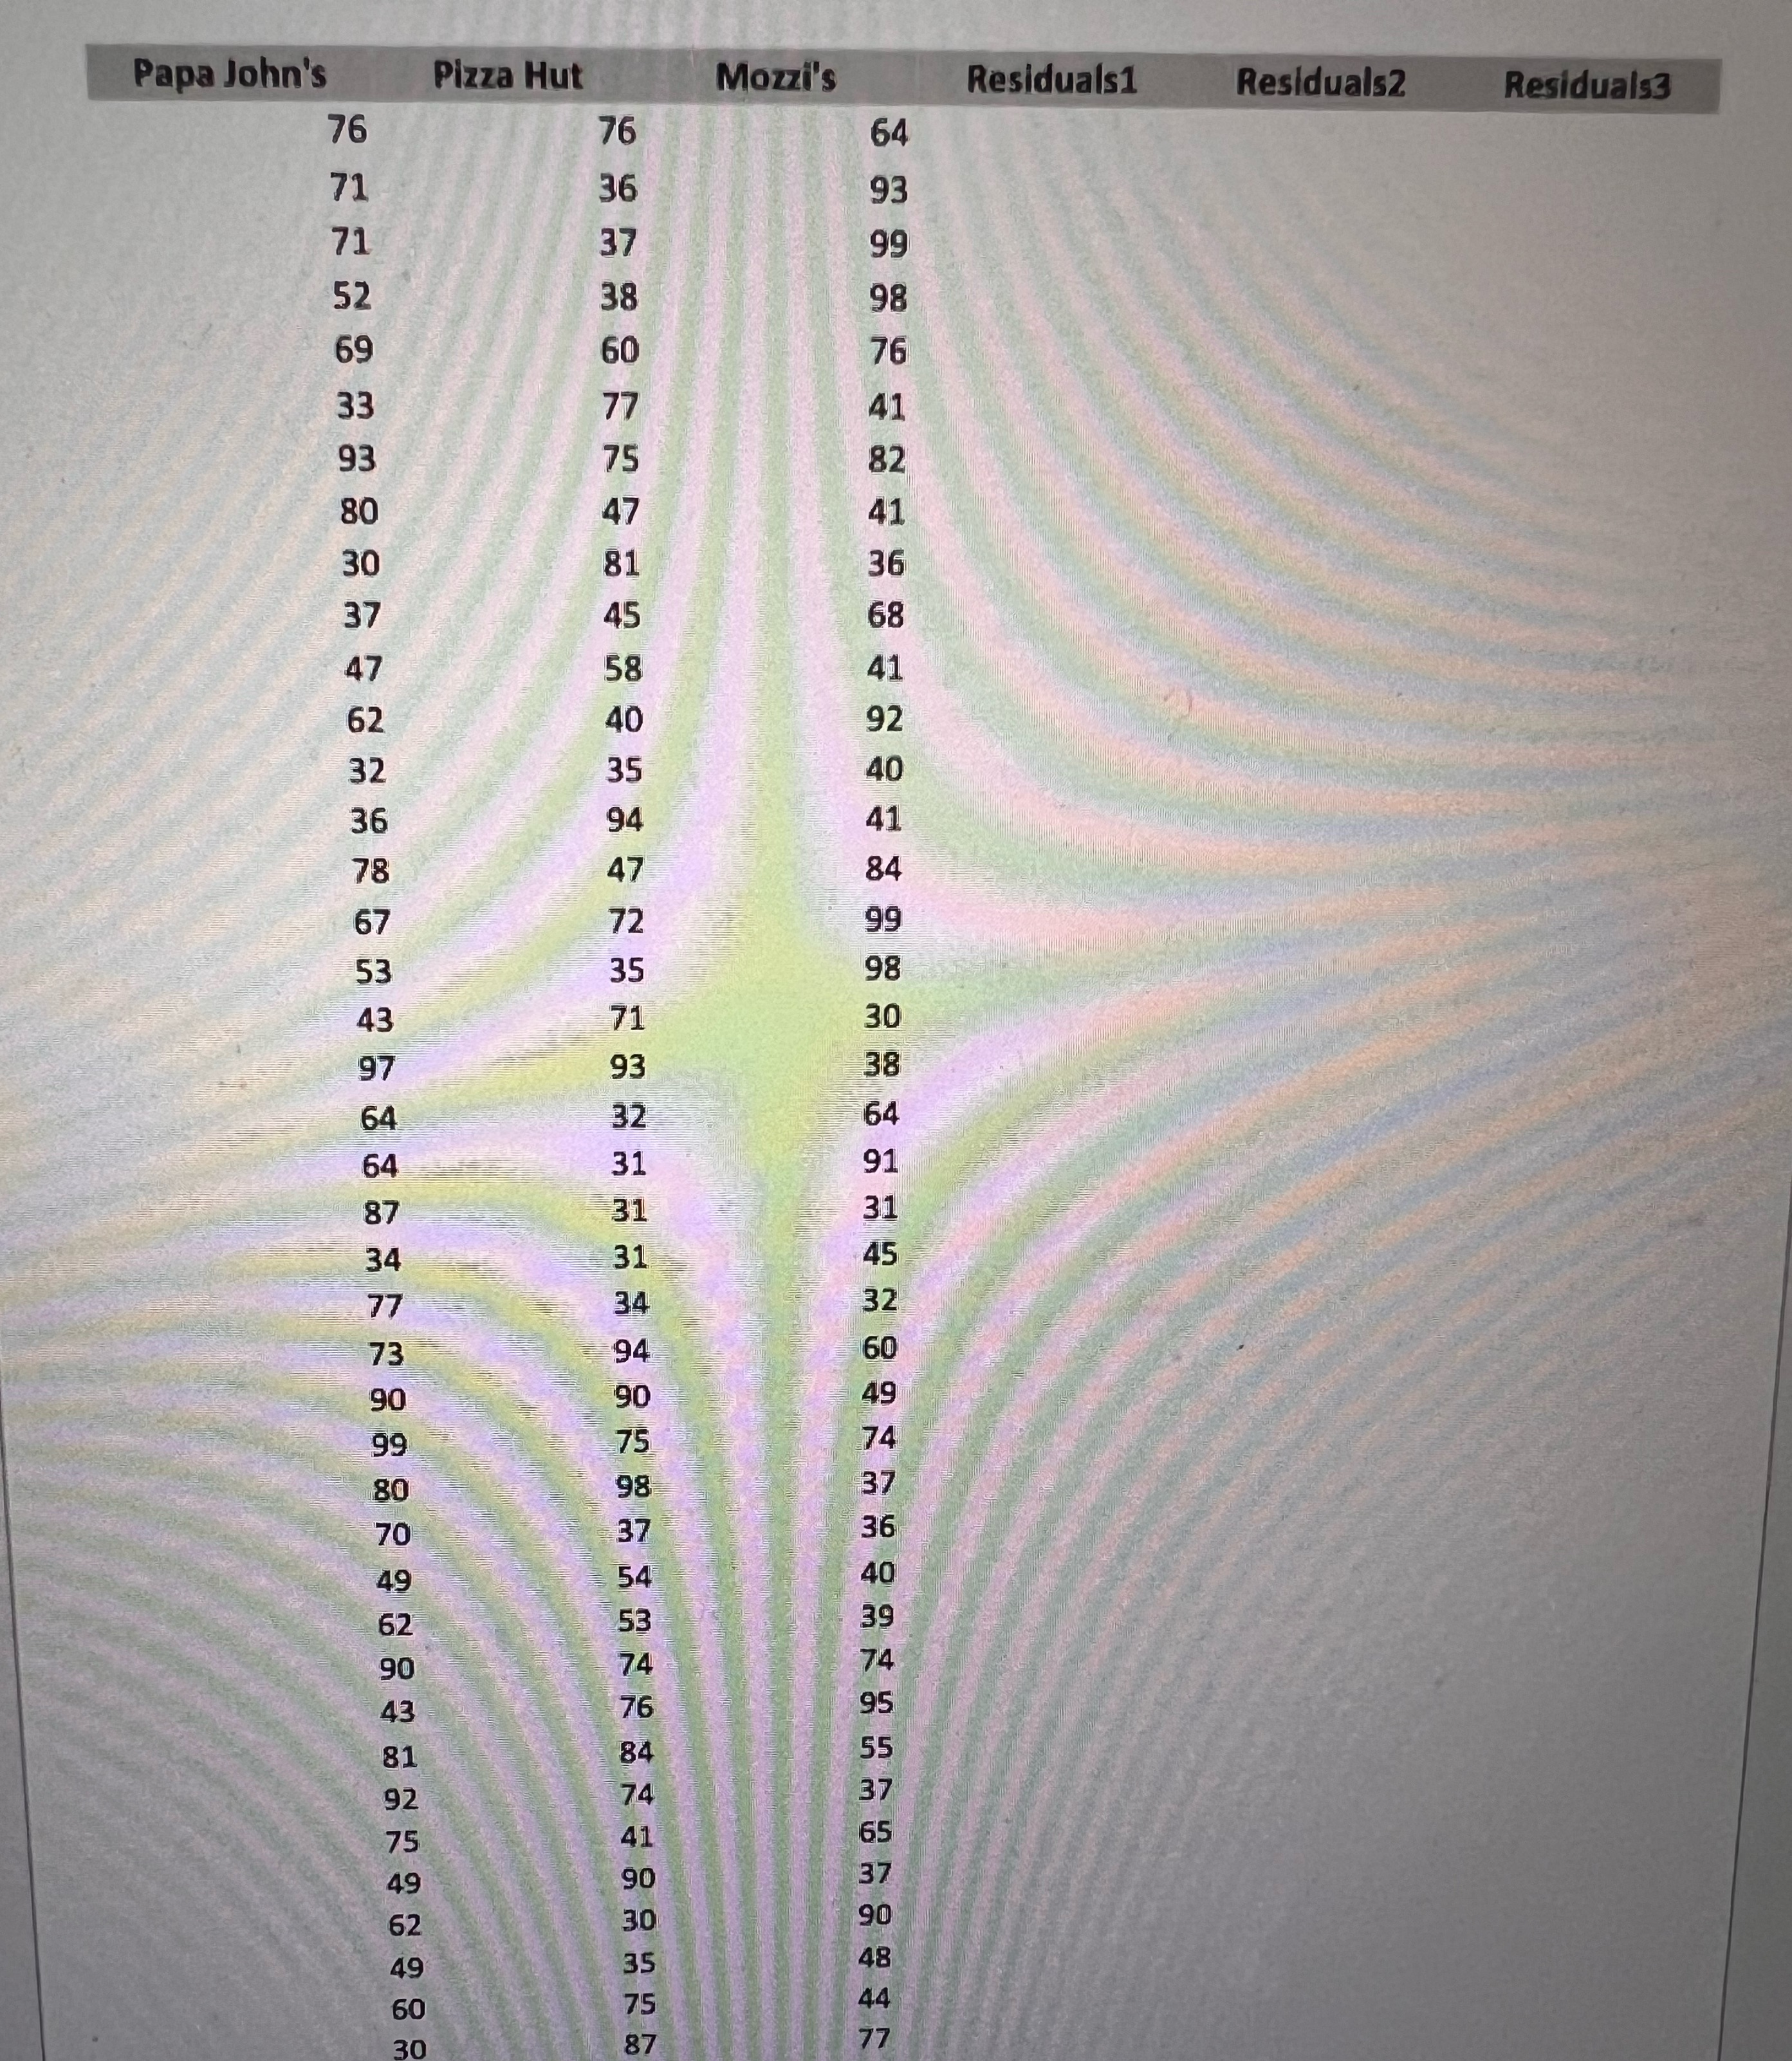
Data
\f
Step by Step Solution
There are 3 Steps involved in it

Get step-by-step solutions from verified subject matter experts