

Question: Hello, Can you please assist with the problem shown below? As well as showing work/explanation so I can gain understanding for this and cureent problems
Hello,
Can you please assist with the problem shown below? As well as showing work/explanation so I can gain understanding for this and cureent problems similar?
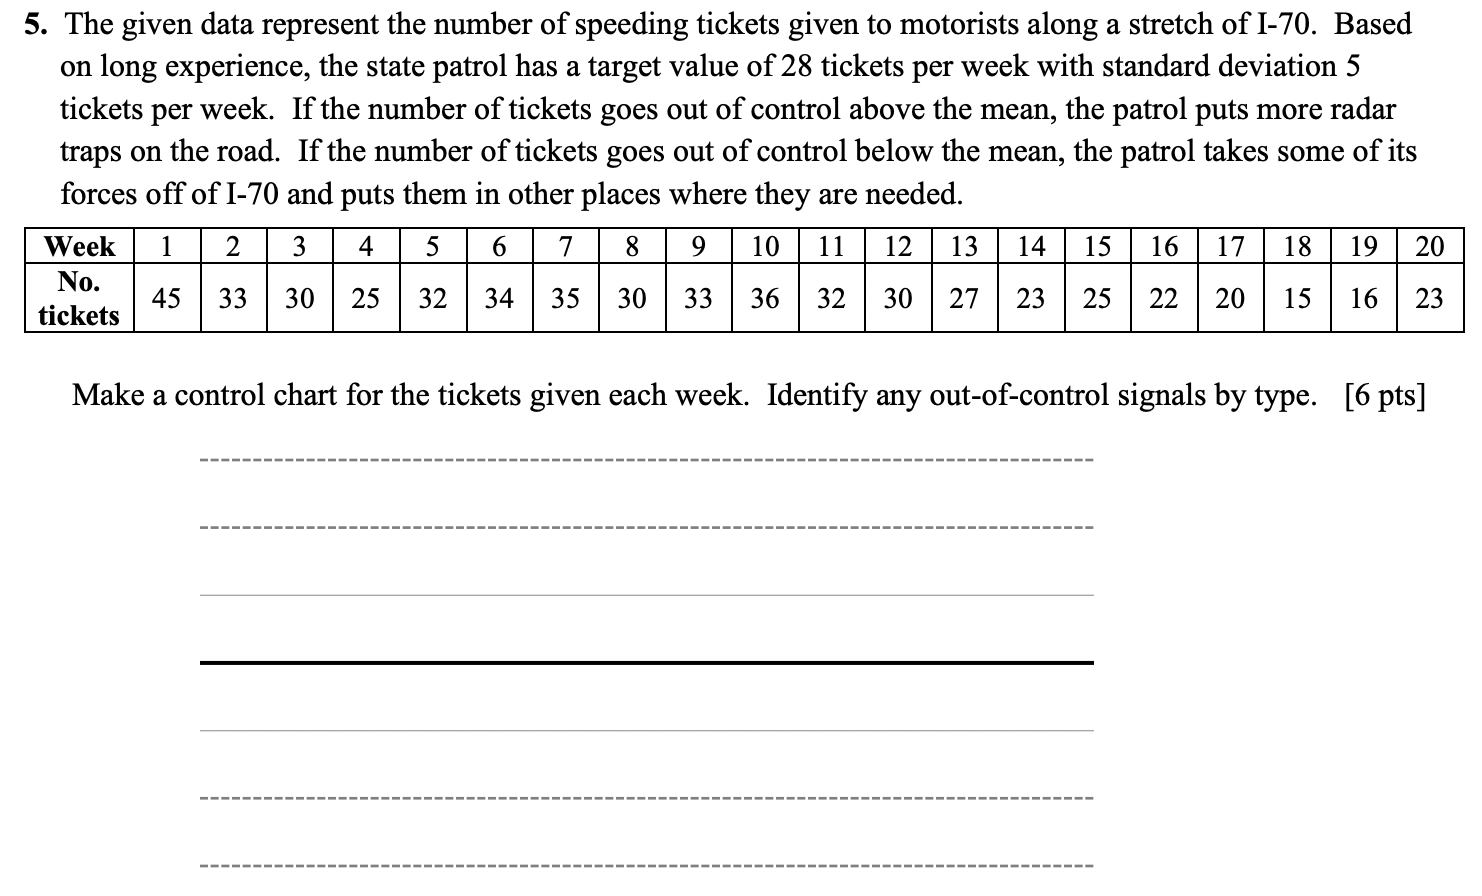
5. The given data represent the number of speeding tickets given to motorists along a stretch of I70. Based on long experience, the state patrol has a target value of 28 tickets per week with standard deviation 5 tickets per week. If the number of tickets goes out of control above the mean, the patrol puts more radar traps on the road. If the number of tickets goes out of control below the mean, the patrol takes some of its forces off of 1-70 and puts them in other places where they are needed. "um-\"nunnummm tickets Make a control chart for the tickets given each week. Identify any out-ofcontrol signals by type. [6 pts]
Step by Step Solution
There are 3 Steps involved in it

Get step-by-step solutions from verified subject matter experts