

Question: Hello can you please help me solve this! I got stuck half way through and can you please please include the formula! Thank you so
Hello can you please help me solve this! I got stuck half way through and can you please please include the formula! Thank you so much!!!!!
Use Excel to evaluate the following capital budgeting project for the best, base, and worst cases. You will calculate the following values for each case:
- Net present value
- Internal rate of return
- Profitability Index
- Average Accounting Return
- Payback
- Discounted payback
The cash flows change every year because of the assumptions below.
Note: You must do your calculations in Excel. Do not do them with a calculator and type them in, except for PAYBACK and DISCOUNTED PAYBACK. Example: For the base case, unit sales is 110,000 in year 1. The assumptions state that unit sales will decline in the second year by 1,000. Assuming that the year 1 unit sales is in cell M246 (note: it isnt really in cell M246), year 2 unit sales would be in N246 and the formula in that cell would be
=M246-1,000
Here is information about the project.
- Initial Fixed Asset investment= $11,000,000
- Net Working Cap Requirement= $900,000
- Time frame = 5 years
- Marginal tax rate= 21%
- Required rate of return=12%
- 5-year straight line depreciation with assumption of zero salvage value
- For negative net pre-tax incomes, you must include negative taxes, i.e., if the project loses money, it will reduce the companys taxable income, thus lowering its tax bill.
- PUT ALL THREE CASES ON ONE EXCEL SPREADSHEET; DO NOT USE TABS TO HAVE THREE SEPARATE SHEETS.
- ALL COLUMNS SHOULD FIT WITHIN THE WIDTH OF ONE PRINTED PAGE. THEY SHOULD NOT BLEED ONTO A SECOND PAGE.
Base Worst Best
Unit Sales year 1= 110,000 98,000 122,000
Change in unit sales per year= -1,000 -2,000 0
Price/unit year 1= $220 $190 $250
Change in price per year= -$5 -$10 $0
Variable Cost/unit year 1= $145 $155 $135
Change in variable cost/unit per year= +$1 +$2 $0
Fixed costs year 1= $40,000 $40,000 $40,000
Change in fixed costs per year= +$100 +$500 -$300
Actual salvage value= $120,000 $100,000 $140,000
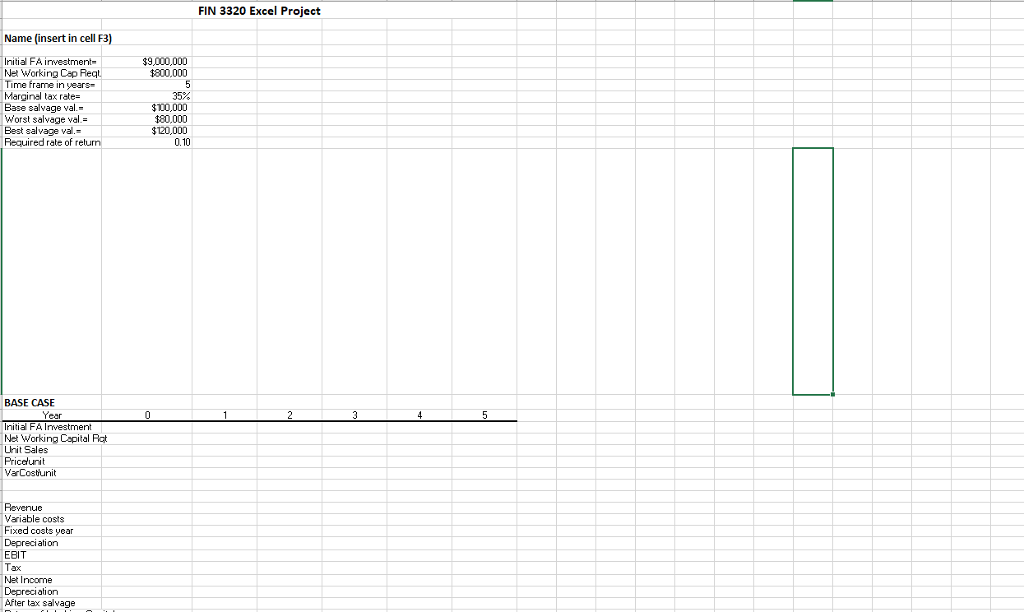
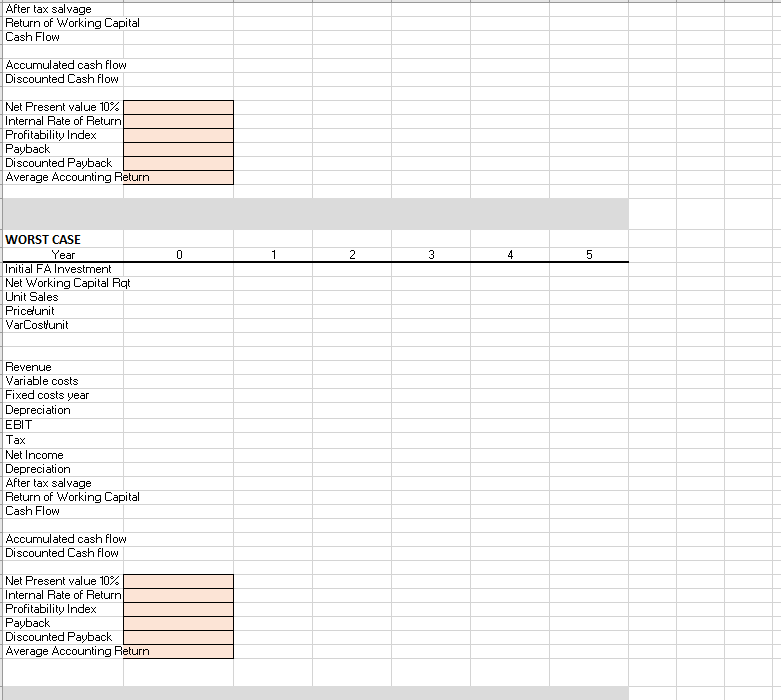
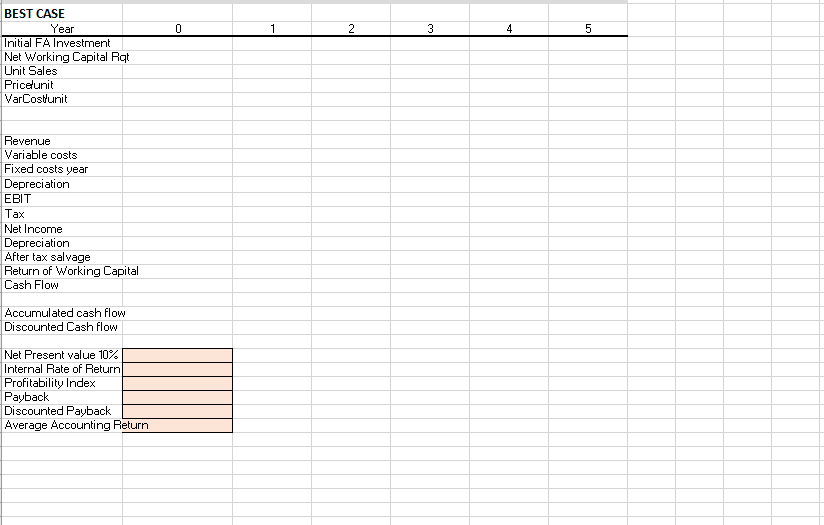
FIN 3320 Excel Project Name [insert in cell 3) $9,000,000 $800.000 Initial FA investment Net Working Cap Peal Time frame in years Marginal tax rate= Base salvage val.- Worst salvage vel. Best salvage val. Required rate of return 35% $70,000 $80,000 $120,000 0.10 BASE CASE Year 01234 Initial FA Investment Net Working Capital Pat Unit Sales Price unit VarCostunit Revenue Variable costs Fixed costs year Depreciation EBIT Tax Net Income Depreciation After tax salvage After tax salvage Return of Working Capital Cash Flow Accumulated cash flow Discounted Cash flow Net Present value 10% Internal Rate of Return Profitability Index Payback Discounted Payback Average Accounting Return WORST CASE Year 0 1 2 3 4 5 Initial FA Investment Net Working Capital Rat Unit Sales Price unit VarCost'unit Revenue Variable costs Fixed costs year Depreciation EBIT Tax Net Income Depreciation After tax salvage Return of Working Capital Cash Flow Accumulated cash flow Discounted Cash flow Net Present value 10% Internal Rate of Return Profitability Index Payback Discounted Payback Average Accounting Return 2 3 4 5 BEST CASE Year Initial FA Investment Net Working Capital Rat Unit Sales Price'unit VarCostunit Revenue Variable costs Fixed costs year Depreciation EBIT Tax Net Income Depreciation After tax salvage Return of Working Capital Cash Flow Accumulated cash flow Discounted Cash flow Net Present value 10% Internal Rate of Return Profitability Index Payback Discounted Payback Average Accounting Return
Step by Step Solution
There are 3 Steps involved in it

Get step-by-step solutions from verified subject matter experts