

Question: Hello, Can you please help me to understand this logistic regression? This is a fraudulent claim dataset, and I need to examine the results. Thank
Hello,
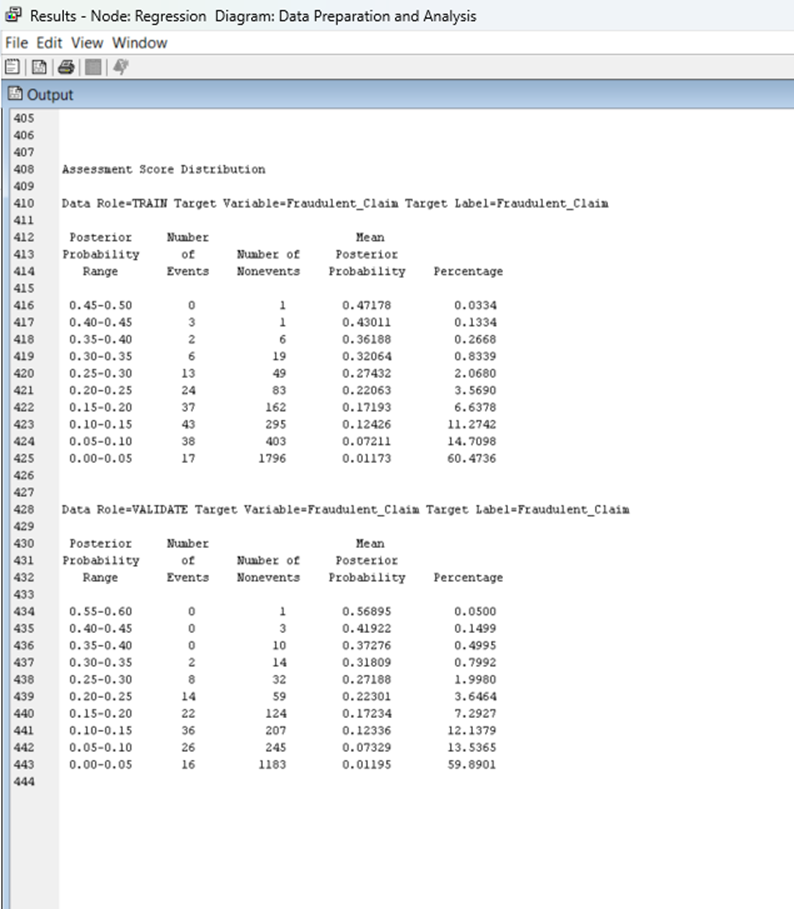
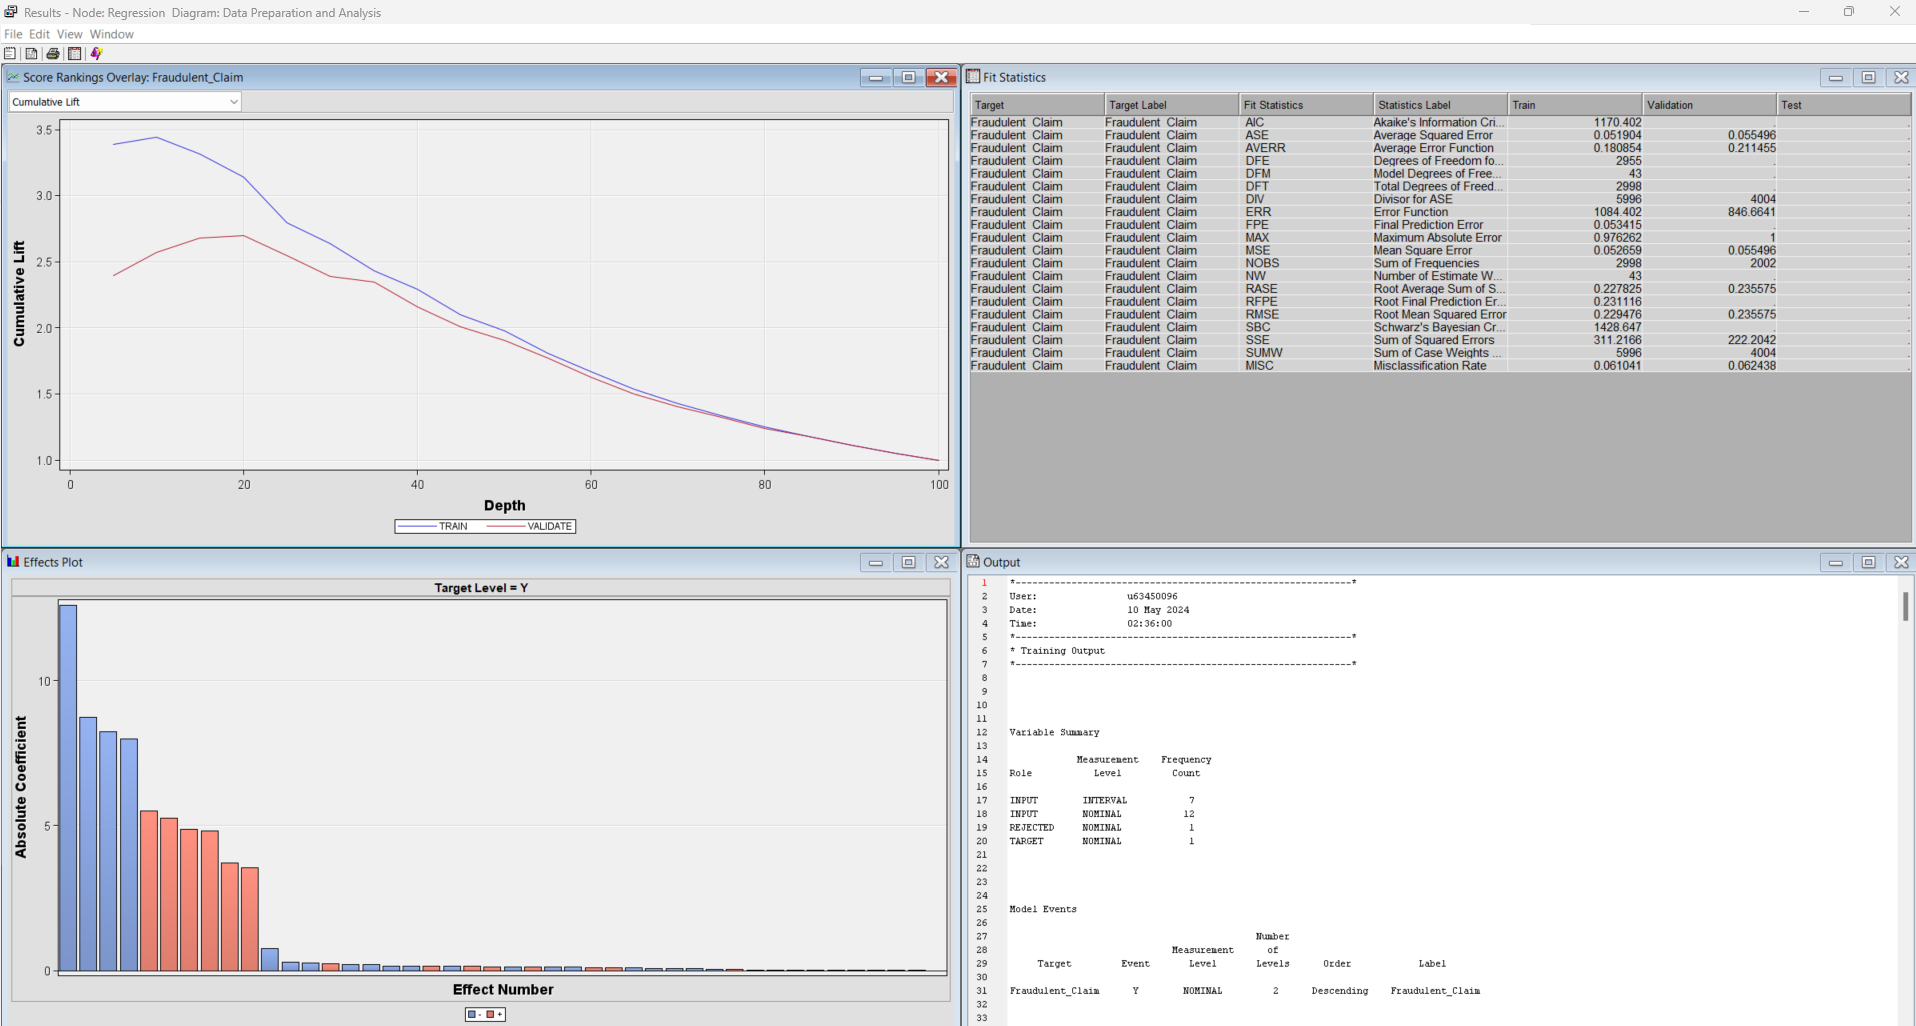
Can you please help me to understand this logistic regression?
This is a fraudulent claim dataset, and I need to examine the results.
Thank you very much
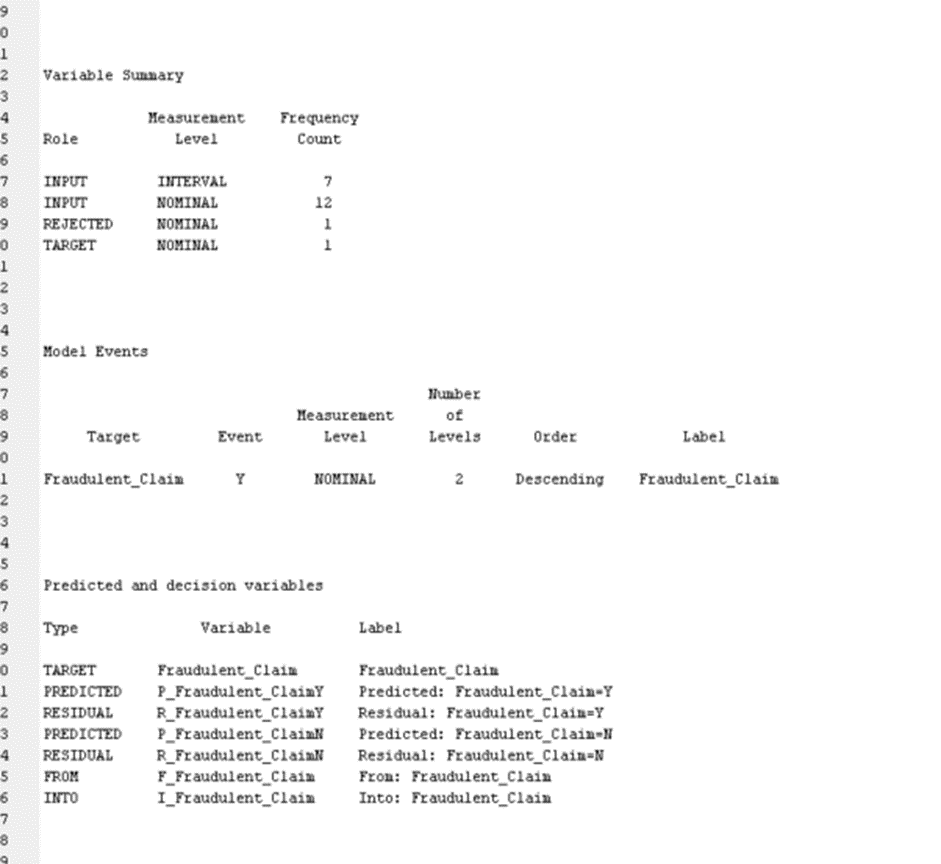
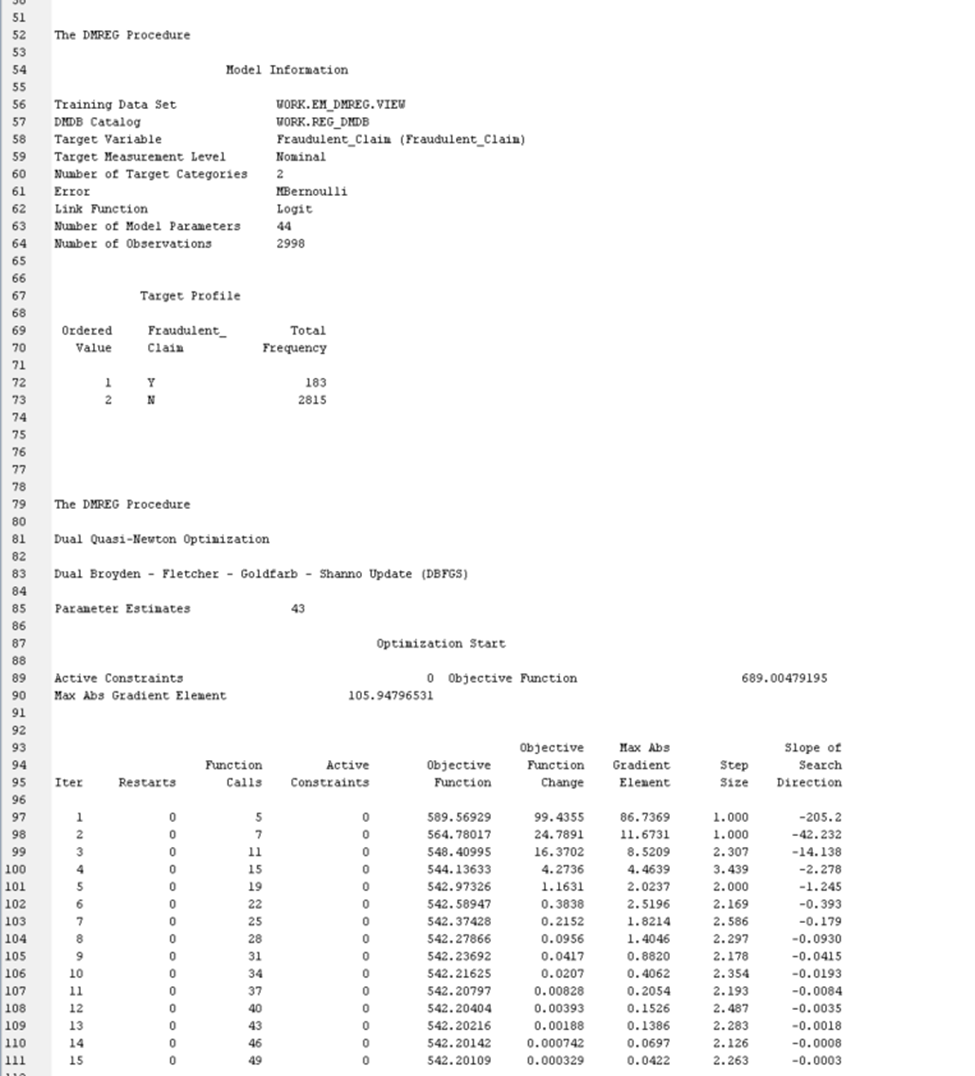
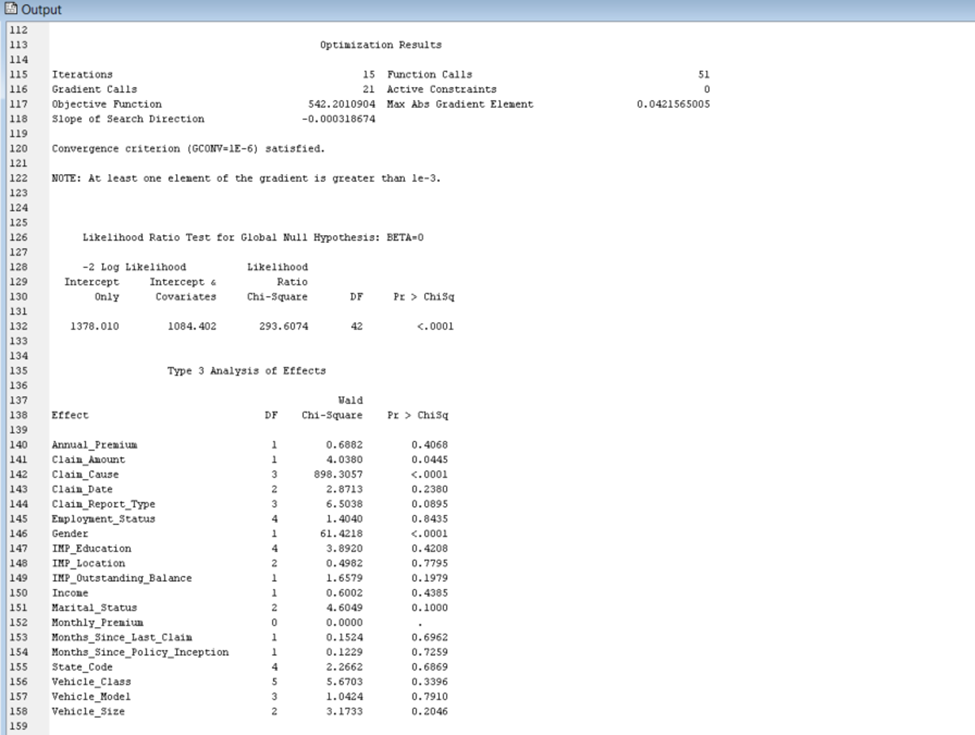
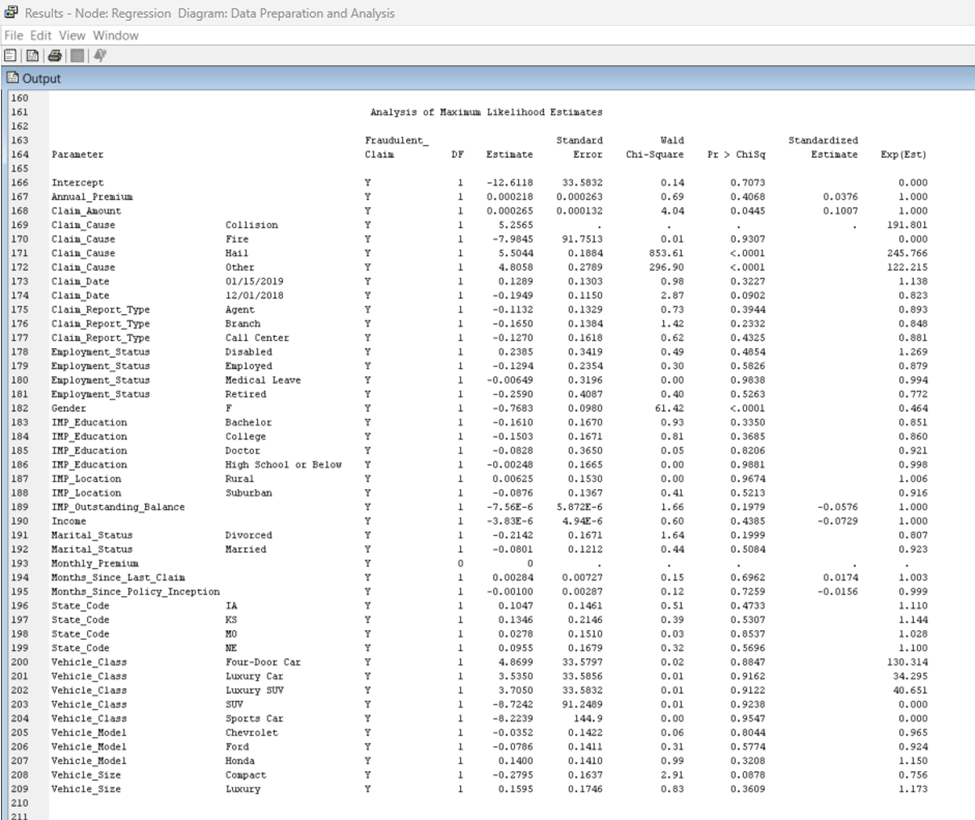
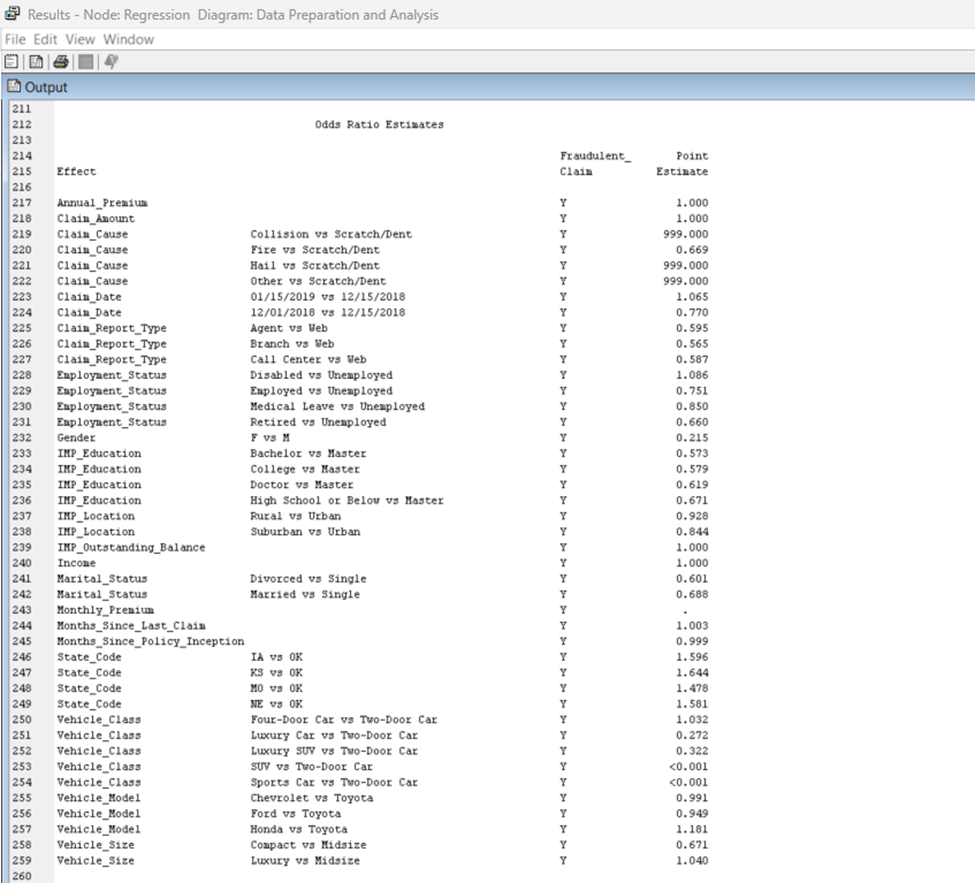
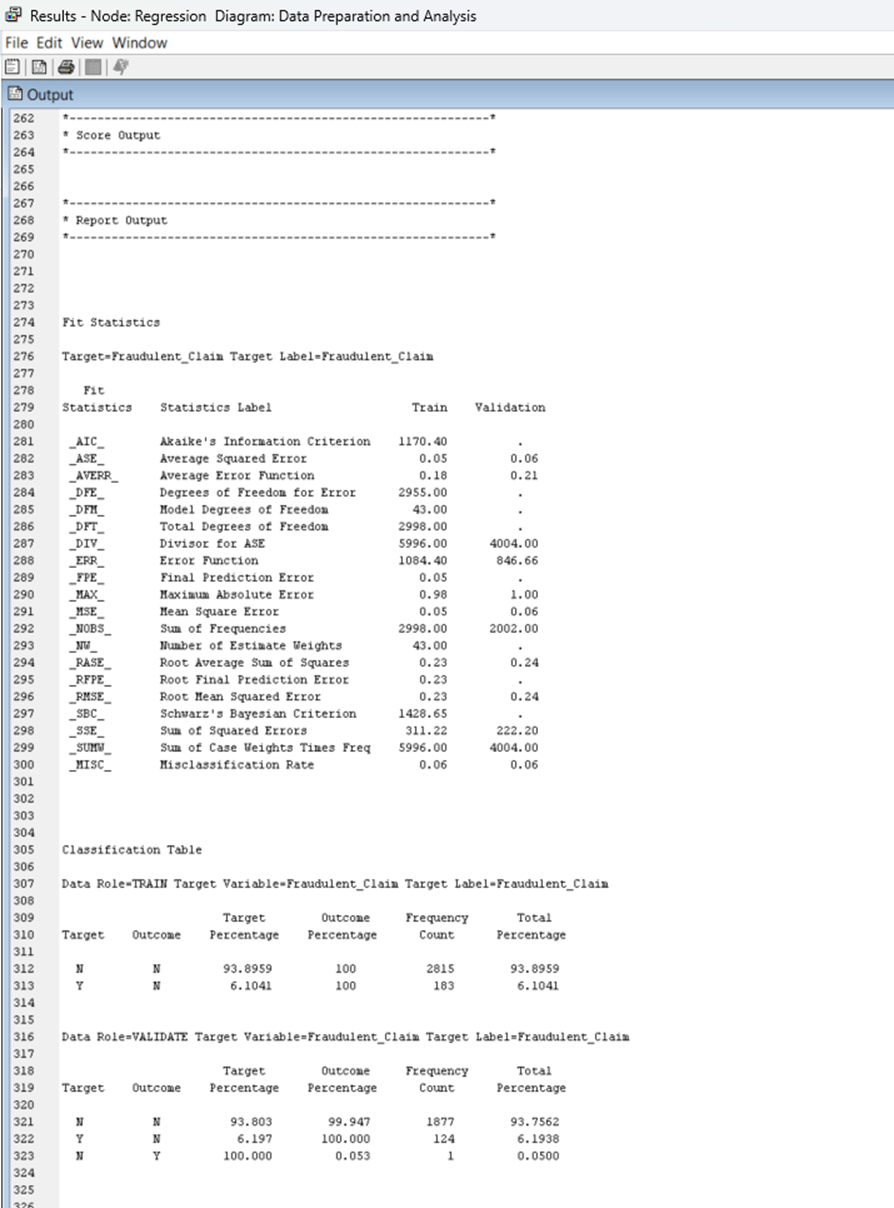
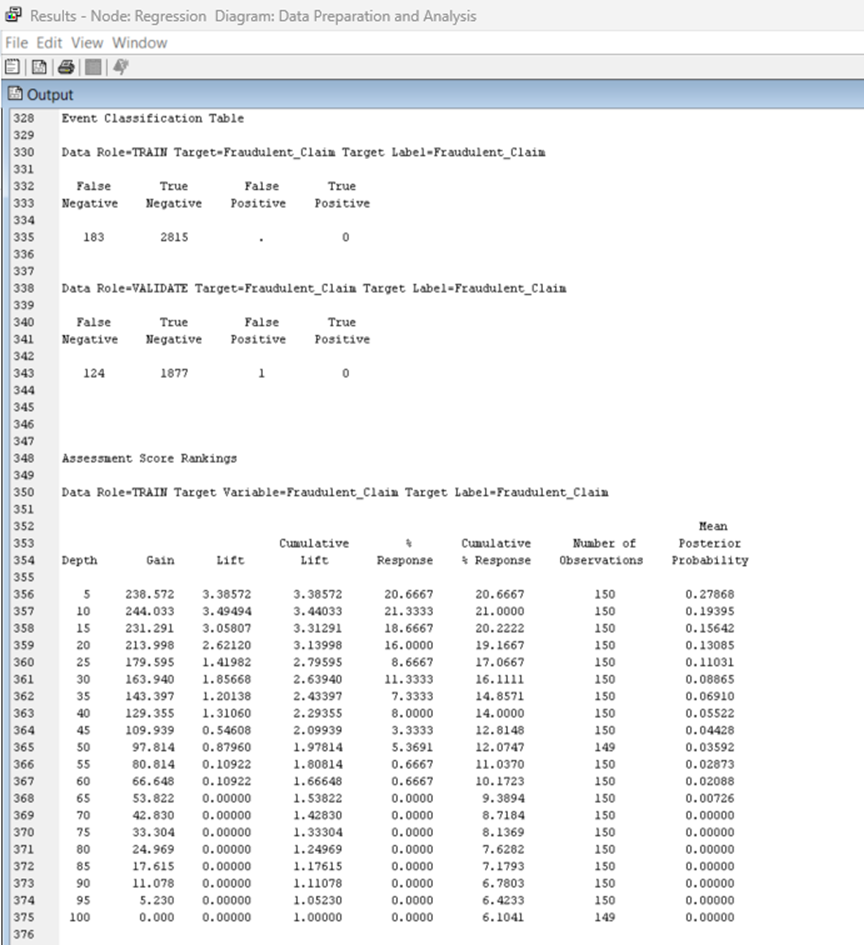
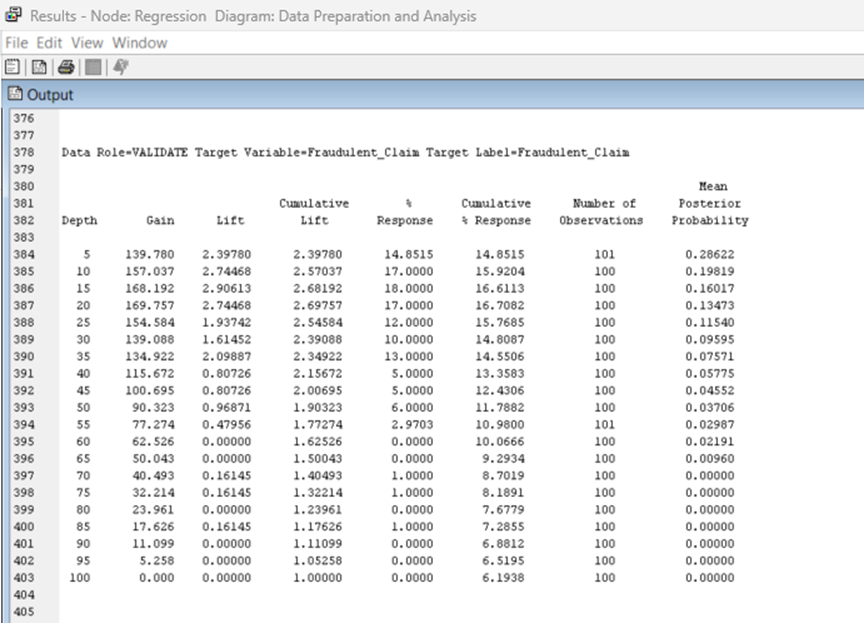
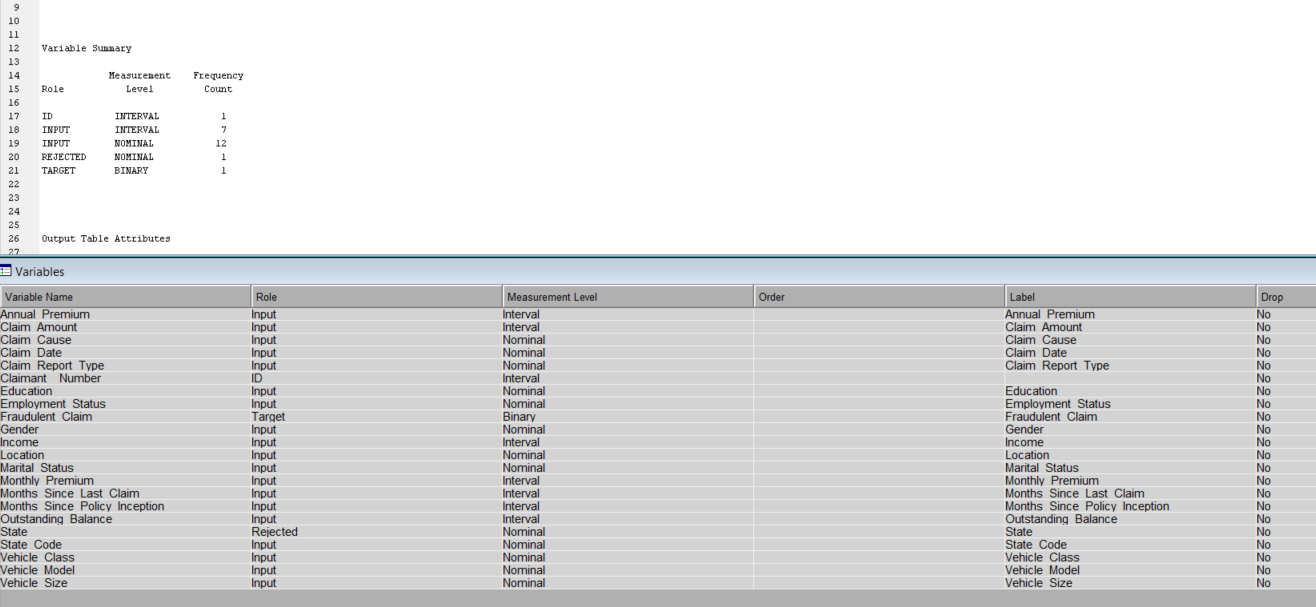
Variable Summary Measurement Frequency Role Level Count INPUT INTERVAL 7 INPUT NOMINAL 12 REJECTED NOMINAL TARGET NOMINAL Model Events Number Measurement Target Event Level Levels Order Label Fraudulent_Claim Y NOMINAL 2 Descending Fraudulent_Claim Predicted and decision variables Type Variable Label TARGET Fraudulent_Claim Fraudulent_Claim PREDICTED P_Fraudulent_ClaimY Predicted: Fraudulent_Claim-Y RESIDUAL R_Fraudulent_ClaimY Residual: Fraudulent_Claim=Y PREDICTED P_Fraudulent_ClaimN Predicted: Fraudulent_Claim-N RESIDUAL R_Fraudulent_ClaimN Residual: Fraudulent_Claim-N FROM F Fraudulent_Claim From: Fraudulent_Claim INTO I_Fraudulent_Claim Into: Fraudulent_ClaimThe DMREG Procedure 53 Model Information 56 Training Data Set WORK. EM_DMREG. VIEW 57 DNDB Catalog WORK. REG_DNDB 58 Target Variable Fraudulent_Claim (Fraudulent_Claim) 59 Target Measurement Level Nominal 60 Number of Target Categories 2 61 Error MBernoulli 62 Link Function Logit 63 Number of Model Parameters 44 64 Number of Observations 2998 65 66 67 Target Profile Ordered Fraudulent_ Total 70 Value Claim Frequency 72 183 NP Y 73 2815 74 75 The DMREG Procedure 288287838 Dual Quasi-Newton Optimization Dual Broyden - Fletcher - Goldfarb - Shanno Update (DBFGS) 85 Parameter Estimates 86 87 Optimization Start 88 89 Active Constraints 0 Objective Function 689. 00479195 90 Max Abs Gradient Element 105. 94796531 T6 92 93 Objective Max Abs Slope of 94 Function Active Objective Function Gradient Step Search 95 Iter Restarts Calls Constraints Function Change Element Size Direction 96 97 589. 56929 99. 4355 86. 7369 1. 000 -205.2 98 564. 78017 24. 7891 11. 6731 1. 000 42. 232 99 548. 40995 16.3702 8. 5209 2. 30 -14. 138 100 544. 13633 4. 2736 4. 4639 3.439 -2. 278 101 542. 97326 1. 1631 2. 0237 2. 000 -1. 245 102 542. 58947 0. 3838 2. 5196 2. 169 -0.393 103 542. 37428 0.2152 1. 8214 2. 586 -0. 179 104 542.27866 0. 0956 1. 4046 2.297 -0. 0930 105 542. 23692 0. 0417 0. 8820 2. 178 -0. 0415 106 542. 21625 0. 0207 0. 4062 2. 354 -0. 0193 107 542. 20797 0. 00828 0. 2054 2. 193 -0. 0084 108 542. 20404 0. 00393 0. 1526 2. 487 -0. 0035 109 542. 20216 0. 00188 0. 1386 2.283 -0. 0018 110 542. 20142 0. 000742 0. 0697 2. 126 -0. 0008 111 542. 20109 0. 000329 0. 0422 2.263 -0. 0003Output 112 113 Optimization Results 114 115 Iterations 15 Function Calls 51 116 Gradient Calls 21 Active Constraints 117 Objective Function 542. 2010904 Max Abs Gradient Element 0.0421565005 118 Slope of Search Direction -0. 000318674 119 120 Convergence criterion (GCONV=1E-6) satisfied. 121 122 NOTE: At least one element of the gradient is greater than le-3. 123 124 125 126 Likelihood Ratio Test for Global Null Hypothesis: BETA-0 127 128 -2 Log Likelihood Likelihood 129 Intercept Intercept Ratio 130 Only Covariates Chi-Square DF Pr > Chisq 131 132 1378. 010 1084. 402 293. 6074 42 <.0001 type analysis of effects bald effect df chi-square pr> Chisq 139 140 Annual_Premium 0. 6882 0. 4068 141 Clain_Amount 4. 0380 0. 0445 142 Claim_Cause 898. 3057 <. claim_date claim_report_type employment_status gender imp_education imp_location n imp_outstanding_balance income marital_status monthly_premium months_since_last_claim months_since_policy_inception state_code vehicle_class vehicle_model vehicle_size node: regression diagram: data preparation and analysis file edit view window output of maximum likelihood estimates fraudulent_ standard wald standardized parameter claim df estimate chi-square pr> Chisq Estimate Exp (Est) 165 166 Intercept -12. 6118 33. 5832 0.14 0. 7073 0.000 167 Annual_Premium 0. 000216 0. 000263 0.69 0. 4068 0. 0376 1. 000 168 Clain_Amount 0. 000265 0. 000132 4.04 0. 0445 0. 1007 1.000 169 Claim_Cause Collision 5.2565 191. 801 170 Clain_Cause Fire -7.9845 91. 7513 0. 01 0.9307 0.000 171 Claim_Cause Hail 5. 5044 0. 1884 853.61 <. clain_cause other claim_date clain_date claim_report_type agent branch call center employment_status disabled employed medical leave retired gender imp_education bachelor . college doctor imp education high school or below imp_location rural suburban imp_outstanding_balance income marital_status divorced marital status married monthly_premium months_since_last_claim months_since_policy_inception state_code ia ks mo ne vehicle_class four-door car luxury suv sports vehicle_model chevrolet ford honda vehicle_size compact node: regression diagram: data preparation and analysis file edit view window output odds ratio estimates fraudulent_ point effect clair estimate annual_premium claim_amount claim_cause collision vs scratch fire hail v="12/15/2018" v3 web unemployed f m master urban single ok me two-door toyota midsize score report fit statistics target="Fraudulent_Claim" label="Fraudulent_Claim" train validation aic akaike information criterion ase average squared error averr function dfe_ degrees of freedom for dfhi model _dft_ total div divisor err _fpe_ final prediction max maximum absolute mse_ mean square nobs sun frequencies nw number weights rase root squares .24 rfpe rmse_ sbc_ schwarz bayesian sse errors _sunw case times freq _misc_ misclassification rate classification table role-train variable-fraudulent_claim label-fraudulent_claim outcome frequency percentage count role="VALIDATE" variable="Fraudulent_Claim" results brae n s event claim labelefraudulent_claim false true negative positive rolesvalidate labels="Fraudulent_Claim" assessment rankings variablesfraudulent nean cumulative posterior depth gain lifc liftc response observations probabilicy b0 dr e s0 b2 distribution roles="TRAIN" variablesfraudulent_claim labelsfraudulent_claim probability nunber range events nonevents x overlay: fraudulent_claim o lift test fraudulent cri .180854 dfe fo. dfm free. det freed. fpe mse jobs sum w.. s. er. rmse sbc cr... sumw .. misc ill effects plot level="Y" user date may haudwn time training summary measurement coefficient input interval nominal rejected levels order y descending id binary attributes variables drop name annual premium no amount cause type claimant employment location monthly months since last policy inception outstanding balance state code vehicle class size>
Step by Step Solution
There are 3 Steps involved in it

Get step-by-step solutions from verified subject matter experts