Question: Hello, Can you please provide some commentary/analysis on each part of the cash flow statement with the income statement and balance sheet of the 2
Hello,
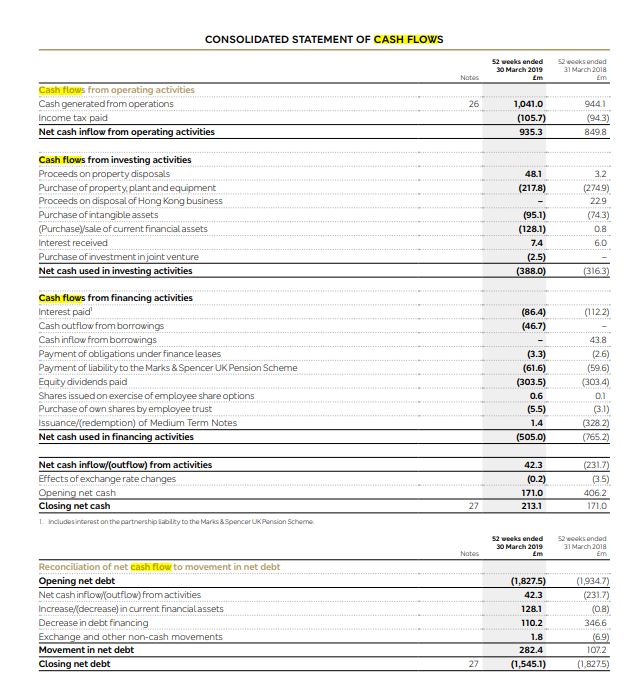
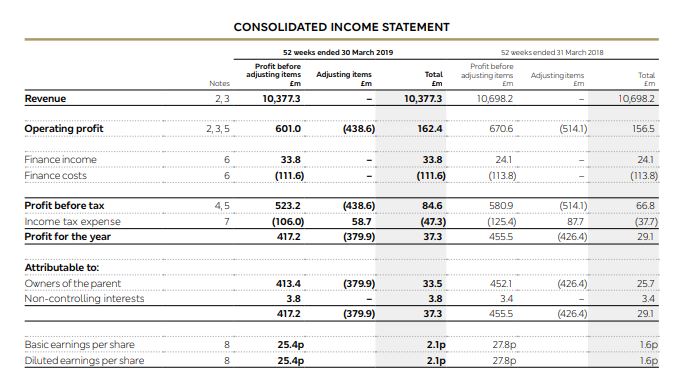
Can you please provide some commentary/analysis on each part of the cash flow statement with the income statement and balance sheet of the 2 companies: Ferrari and Marks and Spence. What additional information does the cash flow statement provide with respect to the balance sheet and income statement?
The main focus is to understand the difference between the 3 financial statements and what are their common elements. Things to look at are EBT, EBIT and EBITDA, WCR and WCR ratios.
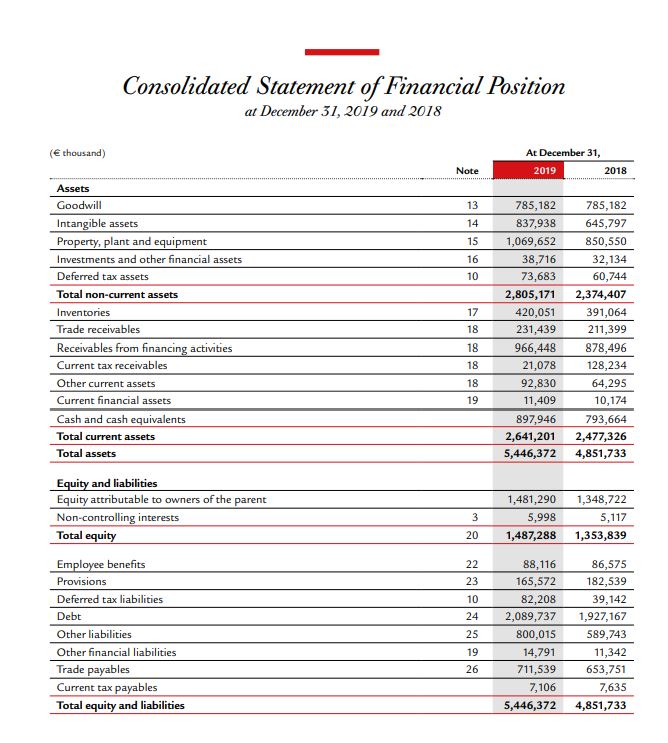
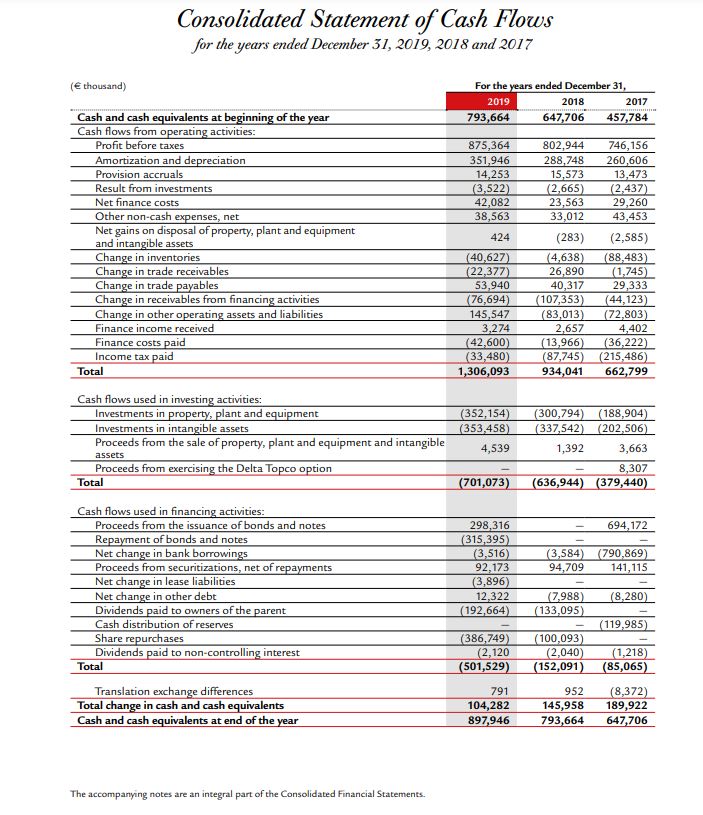
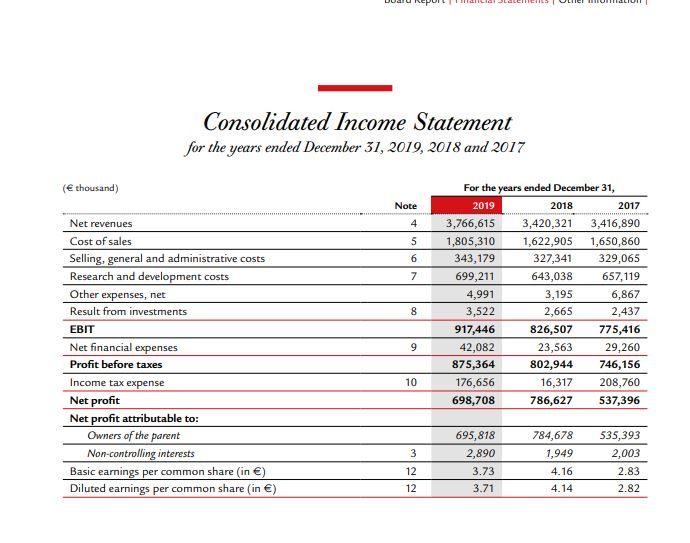
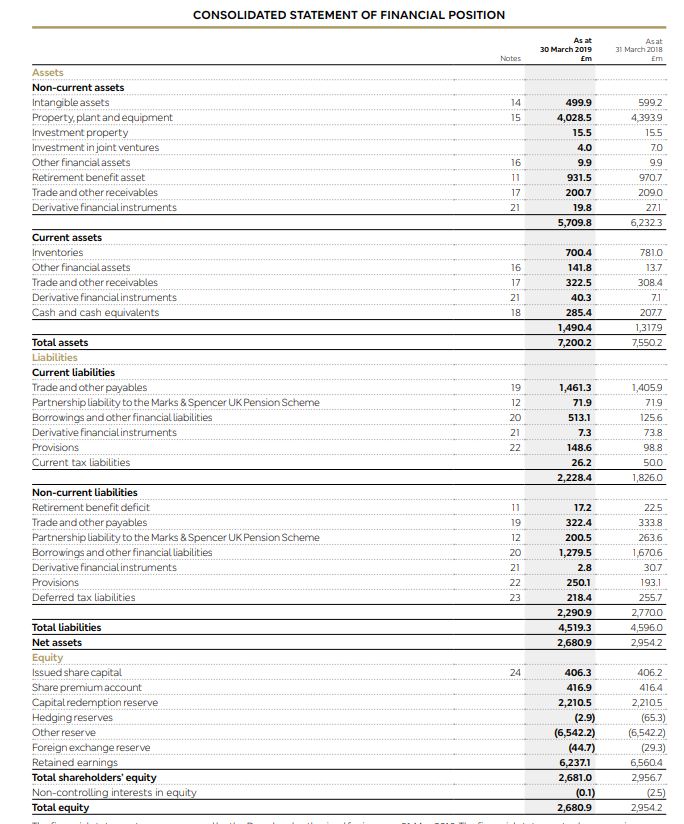
Consolidated Statement of Financial Position at December 31, 2019 and 2018 (E thousand) At December 31, Note 2019 2018 Assets Goodwill 13 785,182 785,182 Intangible assets 14 837,938 645,797 Property, plant and equipment 15 1,069,652 850,550 Investments and other financial assets 16 38,716 32,134 Deferred tax assets 10 73,683 60,744 Total non-current assets 2,805,171 2,374,407 Inventone 17 420,051 391,064 Trade receivables 18 231,439 211,399 Receivables from financing activities 18 966,448 878,496 Current tax receivables 18 21,078 128,234 Other current assets 18 92,830 64,295 Current financial assets 19 11,409 10,174 Cash and cash equivalents 897,946 793,664 Total current assets 2,641,201 2,477,326 Total asset 5,446,372 4,851,733 Equity and liabilities Equity attributable to owners of the parent 1,481,290 1,348,722 Non-controlling interests 3 5,998 5,117 Total equity 20 1,487,288 1,353,839 Employee benefits 22 88, 116 86,575 Provisions 23 165,572 182,539 Deferred tax liabilities 10 82,208 39,142 Debt 24 2,089,737 ,927,167 Other liabilities 25 800,015 589,743 Other financial liabilities 19 14,791 11,342 Trade payables 26 711,539 653,751 Current tax payables 7,106 7,635 Total equity and liabilities 5,446,372 4,851,733Consolidated Statement of Cash Flows for the years ended December 31, 2019, 2018 and 2017 (E thousand) For the years ended December 31, 2019 2018 2017 Cash and cash equivalents at beginning of the year 793,664 647,706 457,784 Cash flows from operating activities: Profit before taxes 875,364 802,944 746, 156 Amortization and depreciation $51,946 288,748 260,606 Provision accruals 14,253 15,573 13,473 Result from investments 3,522) (2,665) 2,437) Net finance costs 42,082 23,563 29,260 Other non-cash expenses, net 38,563 33,012 43,453 Net gains on disposal of property, plant and equipment and intangible assets 424 (283) (2,585) Change in inventories (40,627) 4,638 88,483) Change in trade receivables 22,377) 6,890 1,745) Change in trade payables 53,940 40,317 29,333 Change in receivables from financing activities (76,694) 107,353 (44,123) Change in other operating assets and liabilities 145,547 (83,013) (72,803) Finance income received 3,274 2,657 4,402 Finance costs paid (42,600) 13,966 (36,222) Income tax paid (33,480) (87,745) (215.486) Total 1,306,093 934,041 662,799 Cash flows used in investing activities: Investments in property, plant and equipment (352,154) 300,794) (188,904) nvestments in intangible assets 353,458) 337,542) (202,506) Proceeds from the sale of property, plant and equipment and intangible assets 4,539 1,392 3,663 Proceeds from exercising the Delta Topco option 8,307 Total (701,073) (636,944) (379,440) Cash flows used in financing activities: Proceeds from the issuance of bonds and notes 298,316 694,172 Repayment of bonds and notes 315,395) Net change in bank borrowings (3,516) (3,584) (790,869) Proceeds from securitizations, net of repayments 92,173 94,709 141,115 Net change in lease liabilities 3,896) Net change in other debt 12,322 7,988 (8,280) Dividends paid to owners of the parent (192,664) (133,095) Cash distribution of reserves 119,985) Share repurchases (386,749) 100,093 Dividends paid to non-controlling interest (2,120 (2,040) (1,218) Total (501,529) (152,091) (85,065) Translation exchange differences 791 952 (8,372) Total change in cash and cash equivalents 104,282 145,958 189,922 Cash and cash equivalents at end of the year 897,946 793,664 647,706 The accompanying notes are an integral part of the Consolidated Financial Statements.Consolidated Income Statement for the years ended December 31, 2019, 2018 and 2017 (E thousand) For the years ended December 31, Note 2019 2018 2017 Net revenues 4 3,766,615 3,420,321 3,416,890 Cost of sales 5 1,805,310 1,622,905 1,650,860 Selling, general and administrative costs 6 343,179 327,341 329,065 Research and development costs 7 699,211 643,038 657,119 Other expenses, net 4,991 3,195 6,867 Result from investments 8 3,522 2,665 2.437 EBIT 917,446 826,507 775,416 Net financial expenses 9 42,082 23,563 29,260 Profit before taxes 875,364 802,944 746,156 Income tax expense 10 176,656 16,317 208,760 Net profit 698,708 786,627 537,396 Net profit attributable to: Owners of the parent 695,818 784,678 535,393 Non-controlling interests 3 2,890 1,949 2,003 Basic earnings per common share (in () 12 3.73 4.16 2.83 Diluted earnings per common share (in () 12 3.71 4.14 2.82CONSOLIDATED STATEMENT OF FINANCIAL POSITION As at Asfit 30 March 2019 31 March 2018 Notes Em Em Assets Non-current assets Intangible assets 499.9 599.2 Property, plant and equipment 4,028.5 4,393.9 Investment property 15.5 155 Investment in joint ventures 4.0 70 Other financial assets 16 9.9 9.9 Retirement benefit asset 11 931.5 970.7 Trade and other receivables 17 200.7 2090 Derivative financial instruments 21 19.8 27.1 5,709.8 6,232 3 Current assets Inventories 700.4 7810 Other financial assets 16 141.8 13.7 Trade and other receivables 322.5 308.4 Derivative financial instruments 40.3 7.1 Cash and cash equivalents 285.4 207. 490.4 1,3179 Total assets 7,200.2 7,550.2 Liabilities Current liabilities Trade and other payables 19 1,461.3 ,405.9 Partnership liability to the Marks & Spencer UK Pension Scheme 12 71.9 71.9 Borrowings and other financial liabilities ZO 513.1 125.6 Derivative financial instruments 21 7.3 73.8 Provisions 22 148.6 98.8 Current tax liabilities 26.2 500 2,228.4 ,826.0 Non-current liabilities Retirement benefit deficit 17.2 22.5 Trade and other payables 322.4 333.8 Partnership liability to the Marks & Spencer UK Pension Scheme 12 200.5 263.6 Borrowings and other financial liabilities 20 1,279.5 1,670.6 Derivative financial instruments 21 2.8 30.7 Provisions 22 250.1 193.1 Deferred tax liabilities 23 218.4 255.7 2,290.9 27700 Total liabilities 1,519.3 4,596.0 Net assets 2,680.9 2,954.2 Equity Issued share capital 24 406.3 406.2 Share premium account 416.9 4164 Capital redemption reserve 2,210.5 2,2105 Hedging reserves (2.9) (65.3) Other reserve (6,542.2) (6,542.2) Foreign exchange reserve (44.7) (29.3) Retained earnings 6,237.1 6,5604 Total shareholders' equity 2,681.0 2,956.7 Non-controlling interests in equity (0.1) (2.5) Total equity 2,680.9 2,954.2CONSOLIDATED STATEMENT OF CASH FLOWS 52 wicks ended 52 weeks andod 30 March 2019 31 March 2018 Notes Em Cash flows from operating activities Cash generated from operations 1,041.0 9441 Income tax paid (105.7) (94.3) Net cash inflow from operating activities 935.3 849.8 Cash flows from investing activities Proceeds on property disposals 48.1 3.2 Purchase of property, plant and equipment (217.8) (2749) Proceeds on disposal of Hong Kong business 229 Purchase of intangible assets (95.1) (743) (Purchase)/sale of current financial assets (128.1) 0.8 Interest received 7.4 6.0 Purchase of investment in joint venture (2.5) Net cash used in investing activities (388.0 3163 Cash flows from financing activities Interest paid (86.4) (1122) Cash outflow from borrowings (46.7) Cash inflow from borrowings 43.8 Payment of obligations under finance leases (3.3) (2.6) Payment of liability to the Marks & Spencer UK Pension Scheme (61.6) (59.6) Equity dividends paid (303.5) (303.4) Shares issued on exercise of employee share options 0.6 0.1 Purchase of own shares by employee trust (5.5) (3.1) issuance/(redemption) of Medium Term Notes 1.4 (328 2) Net cash used in financing activities (505.0 (765.2) Net cash inflow (outflow) from activities 42.3 (231.7) Effects of exchange rate changes (0.2) (3.5) Opening net cash 171.0 406.2 Closing net cash 27 213.1 171.0 Includes interest on the partnership ability to the Marks & Spencer UK Pension Scheme 52 weeks ended 52 weeks anded 30 March 2019 31 March 2018 Notes Em Reconciliation of net cash flow to movement in net debt Opening net debt (1,827.5) 1,9347) Net cash inflow (outflow) from activities 42.3 231.7) Increase (decrease) in current financial assets 128. (0.8) Decrease in debt financing 110.2 346.6 Exchange and other non-cash movements 1.8 (69) Movement in net debt 282.4 107.2 Closing net debt 27 (1,545.1) (1,6275)CONSOLIDATED INCOME STATEMENT 52 weeks ended 30 March 2019 57 weeks ended 31 March 2018 Profit before Profit before adjusting items Adjusting items Total adjusting items Adjustingitems Total Nobos Em Em Em Em Em Em Revenue 2,3 10.377.3 10,377.3 10698.2 10.698.2 Operating profit 2,3, 5 601.0 (438.6) 162.4 670.6 (514.1) 156.5 Finance income 33.8 33.8 24.1 24.1 Finance costs (111.6) (111.6) (113.8) (113.8) Profit before tax 4,5 523.2 (438.6) 84.6 5809 (514.1) 66.8 Income tax expense 7 (106.0) 58.7 (47.3) (125.4) 87.7 (37.7) Profit for the year 417.2 (379.9) 37.3 455.5 (426.4) 29.1 Attributable to: Owners of the parent 413.4 (379.9) 33.5 452.1 (426.4) 257 Non-controlling interests 3.8 3.8 3.4 3.4 417.2 (379.9) 37.3 455.5 (426.4) 29.1 Basic earnings per share 8 25.4p 2.1p 27.8p 16p Diluted earnings per share 8 25.4p 2.1p 27.8p 1.6p