

Question: Hello, could I be given full ap solutions to these four questions? 1. Jury Selection One study of grand juries in Alameda County, California, compared
Hello, could I be given full ap solutions to these four questions?
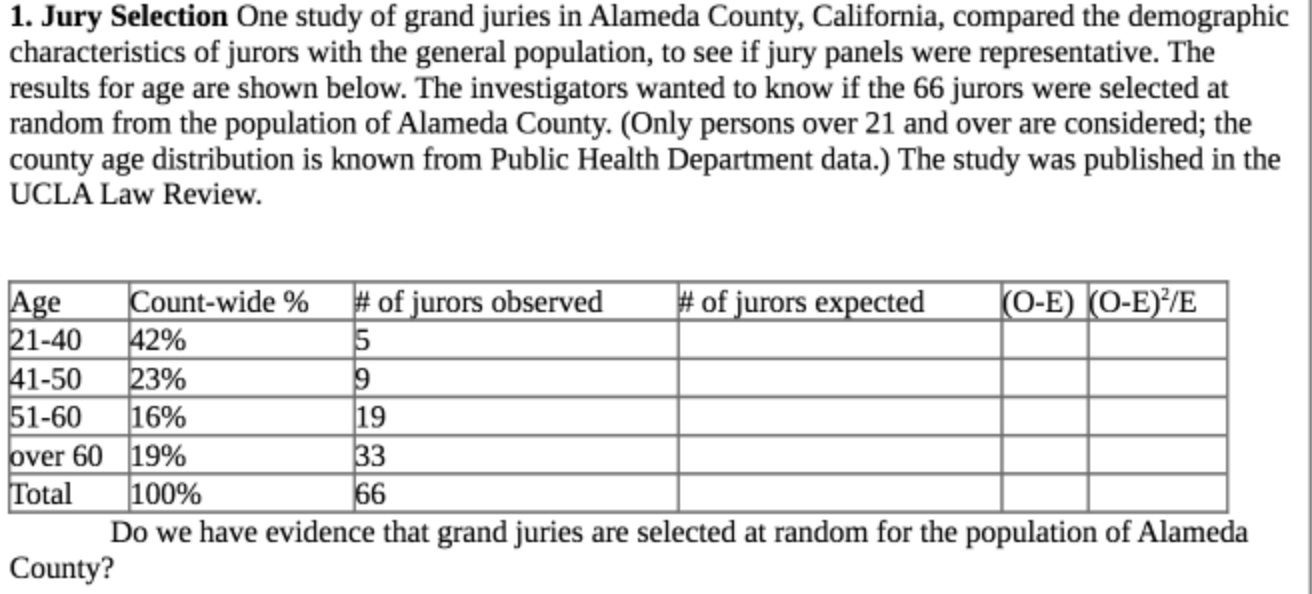
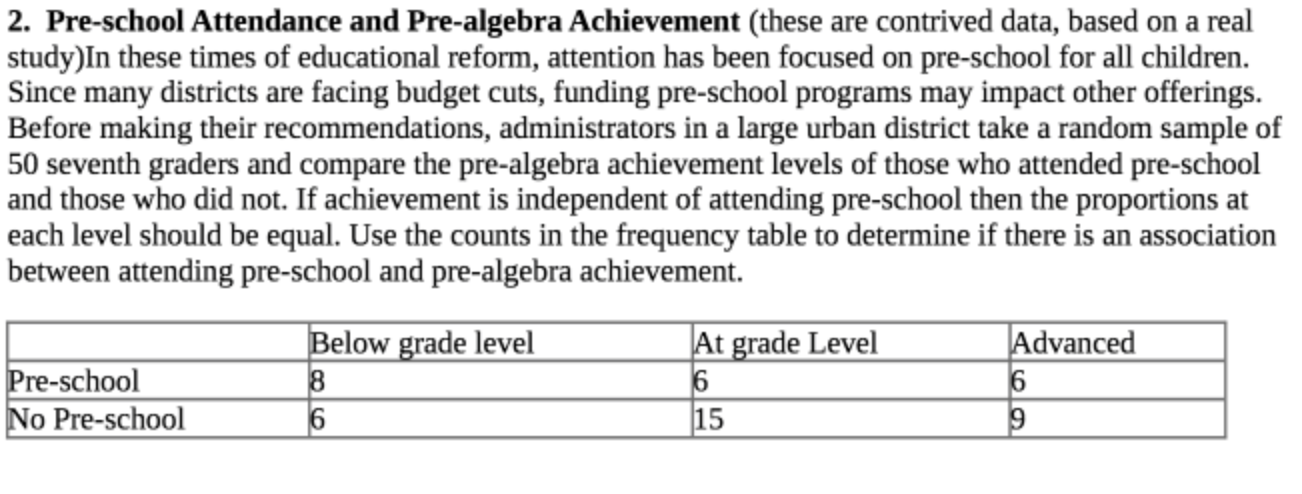
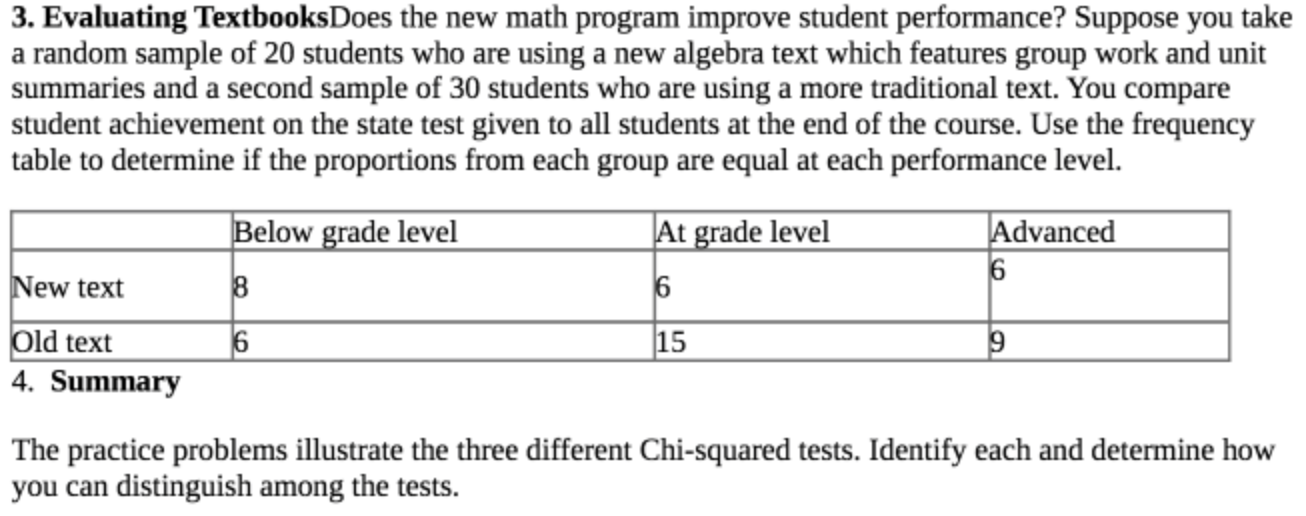
1. Jury Selection One study of grand juries in Alameda County, California, compared the demographic characteristics of jurors with the general population, to see if jury panels were representative. The results for age are shown below. The investigators wanted to know if the 66 jurors were selected at random from the population of Alameda County. (Only persons over 21 and over are considered; the county age distribution is known from Public Health Department data.) The study was published in the UCLA Law Review. -El__-_ me__-_ REE-EEI-_-_ Do we have evidence that grand juries are selected at random for the population of Alameda County? 2. Pie-school Attendance and Pie-algebra Achievement (these are contrived data, based on a real study)in these times of educational reform. attention has been focused on pro-school for all children. Since many districts are facing budget cuts, funding pre-scbool programs may impact other offerings. Before making their recommendations, administrators in a large urban district take a random sample of 50 seventh graders and compare the pre-algebra achievement levels of those who attended pre-school and those who did not. If achievement is independent of attending pre-school then the proportions at each level should be equal. Use the counts in the frequency table to determine if there is an association between attending pre-school and pie-algebra achievement. 3 . Evaluating Textbooks Does the new math program improve student performance ? Suppose you take a random sample of 20 students who are using a new algebra text which features group work and unit Summaries and a second sample of 30 students who are using a more traditional text . You compare student achievement on the state test given to all students at the end of the course . Use the frequency* table to determine if the proportions from each group are equal at each performance level . Below grade level At grade level Advanced 9 New text 8 9 Old text 15 4. Summary The practice problems illustrate the three different Chi- squared tests . Identify each and determine how you can distinguish among the tests
Step by Step Solution
There are 3 Steps involved in it
Lets tackle each question step by step 1 Jury SelectionTo determine if the selection of jurors is random we use the ChiSquared Goodness of Fit test Th... View full answer

Get step-by-step solutions from verified subject matter experts