

Question: Hello, could you explain how to answer this with excel. Thank you. FINANC THE W You can download data for the following questions from finance.yahoo.com.
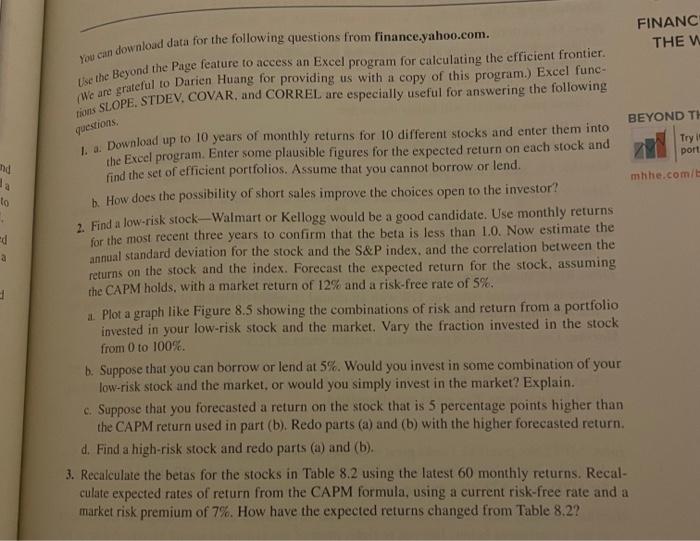
FINANC THE W You can download data for the following questions from finance.yahoo.com. Use the Beyond the Page feature to access an Excel program for calculating the efficient frontier. (We ant grateful to Darien Huang for providing us with a copy of this program.) Excel func- tions SLOPE. STDEV, COVAR. and CORREL are especially useful for answering the following questions, Try is port end ha lo ed a 1 BEYOND TI 1... Download up to 10 years of monthly returns for 10 different stocks and enter them into the Excel program. Enter some plausible figures for the expected return on each stock and find the set of efficient portfolios. Assume that you cannot borrow or lend. mhhe.com/ b. How does the possibility of short sales improve the choices open to the investor'? 2. Find a low-risk stock-Walmart or Kellogg would be a good candidate. Use monthly returns for the most recent three years to confirm that the beta is less than 1.0. Now estimate the annual standard deviation for the stock and the S&P index, and the correlation between the returns on the stock and the index. Forecast the expected return for the stock, assuming the CAPM holds, with a market return of 12% and a risk-free rate of 5%. a. Plot a graph like Figure 8.5 showing the combinations of risk and return from a portfolio invested in your low-risk stock and the market. Vary the fraction invested in the stock from 0 to 100% b. Suppose that you can borrow or lend at 5%. Would you invest in some combination of your low-risk stock and the market, or would you simply invest in the market? Explain. c. Suppose that you forecasted a return on the stock that is 5 percentage points higher than the CAPM return used in part (b). Redo parts (a) and (b) with the higher forecasted return. d. Find a high-risk stock and redo parts (a) and (b). 3. Recalculate the belas for the stocks in Table 8.2 using the latest 60 monthly returns. Recal- culate expected rates of return from the CAPM formula, using a current risk-free rate and a market risk premium of 7%. How have the expected returns changed from Table 8.2? FINANC THE W You can download data for the following questions from finance.yahoo.com. Use the Beyond the Page feature to access an Excel program for calculating the efficient frontier. (We ant grateful to Darien Huang for providing us with a copy of this program.) Excel func- tions SLOPE. STDEV, COVAR. and CORREL are especially useful for answering the following questions, Try is port end ha lo ed a 1 BEYOND TI 1... Download up to 10 years of monthly returns for 10 different stocks and enter them into the Excel program. Enter some plausible figures for the expected return on each stock and find the set of efficient portfolios. Assume that you cannot borrow or lend. mhhe.com/ b. How does the possibility of short sales improve the choices open to the investor'? 2. Find a low-risk stock-Walmart or Kellogg would be a good candidate. Use monthly returns for the most recent three years to confirm that the beta is less than 1.0. Now estimate the annual standard deviation for the stock and the S&P index, and the correlation between the returns on the stock and the index. Forecast the expected return for the stock, assuming the CAPM holds, with a market return of 12% and a risk-free rate of 5%. a. Plot a graph like Figure 8.5 showing the combinations of risk and return from a portfolio invested in your low-risk stock and the market. Vary the fraction invested in the stock from 0 to 100% b. Suppose that you can borrow or lend at 5%. Would you invest in some combination of your low-risk stock and the market, or would you simply invest in the market? Explain. c. Suppose that you forecasted a return on the stock that is 5 percentage points higher than the CAPM return used in part (b). Redo parts (a) and (b) with the higher forecasted return. d. Find a high-risk stock and redo parts (a) and (b). 3. Recalculate the belas for the stocks in Table 8.2 using the latest 60 monthly returns. Recal- culate expected rates of return from the CAPM formula, using a current risk-free rate and a market risk premium of 7%. How have the expected returns changed from Table 8.2
Step by Step Solution
There are 3 Steps involved in it

Get step-by-step solutions from verified subject matter experts