

Question: Hello, GOOD FOLKS! 1)Please interpret both PRE-LEAN AND POST-LEAN CHARTS.Please compare and contrast these probability plots. 2)Does the PRE-LEAN PROBABILITY PLOT SHOW NORMALITY?DOES IT HAVE
Hello, GOOD FOLKS!
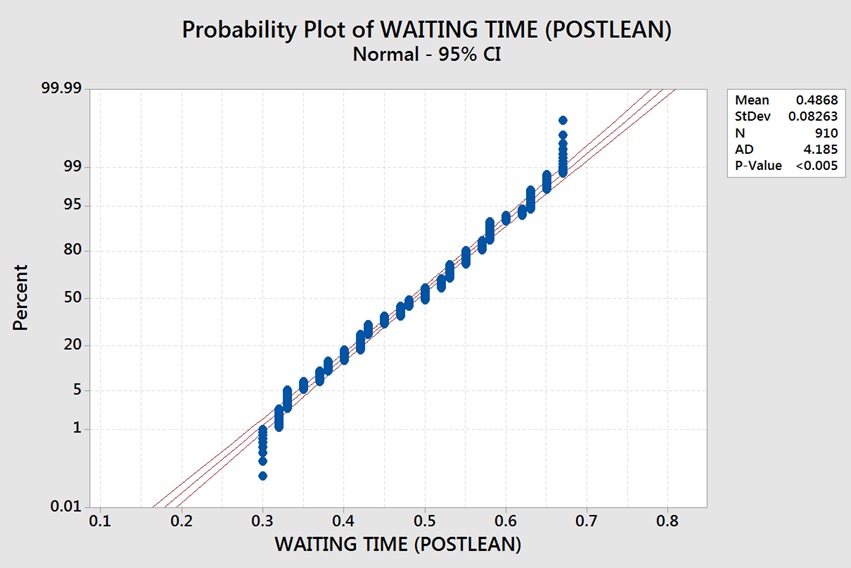
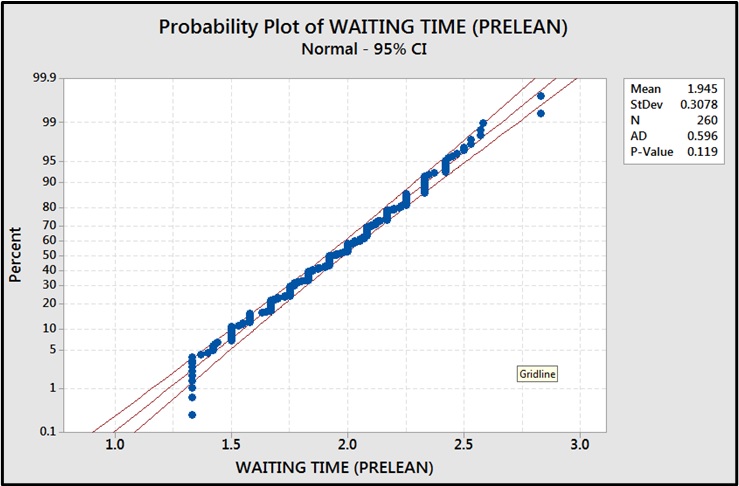
1)Please interpret both PRE-LEAN AND POST-LEAN CHARTS.Please compare and contrast these probability plots.
2)Does the PRE-LEAN PROBABILITY PLOT SHOW NORMALITY?DOES IT HAVE A NORMAL DISTRIBUTION?PLEASE EXPLAIN
3)Does the POST-LEAN PROBABILITY PLOT SHOW NORMALITY?DOES IT HAVE A NORMAL DISTRIBUTION?PLEASE EXPLAIN
4)WHICH PROBABILITY PLOT/CHART IS BETTER AND SHOWS IMPROVEMENT?THE PRE-LEAN OR POST-LEAN? PLEASE EXPLAIN.
5)Based on the attached charts, do you recommend a two-sample t-test (parametric)? if yes, why?
6)Or do you recommend a Mann-Whitney (non-parametric) test?
7)Can we use both two-sample t-test and Mann-Whitney?Would it be a problem if we used both?Why or Why not?
8)Which shows better improvement in waiting time?The PRE-LEAN? OR POST-LEAN?PLEASE state your reason and conclusion.
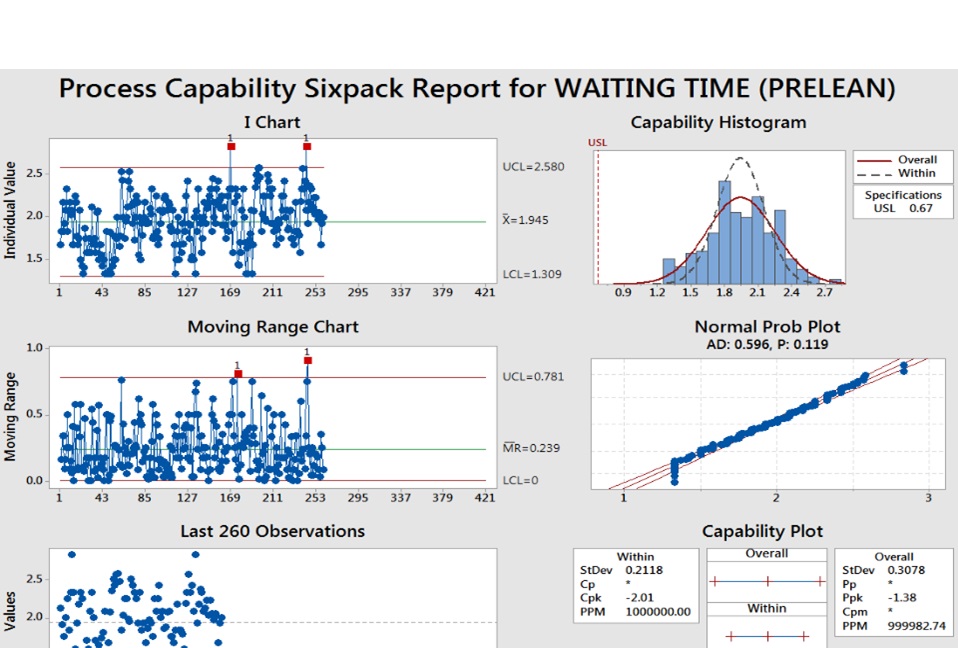
9)PLEASE INTERPRET THE MINITAB CAPABILITY 6 PACK CHARTS AND COMPARE/CONTRAST THEM - both PRE LEAN AND POST LEAN CHARTS.
10)The AIM is to reduce waiting time in hospital appointments.The upper control limit or goal is 40 minutes (.67 decimal hours).WHICH CHART SHOWS THE MOST IMPROVEMENT IN WAITING TIME?
PLEASE NOTE:I already attached the TOTAL 4 charts......it is in jpeg format.Please find them attached.It may take a while to upload due to the size.
PLEASE EXPEDITE.THANK YOU FOR YOUR 100 % SUPPORT!
COURSE HERO IS THE BEST!!
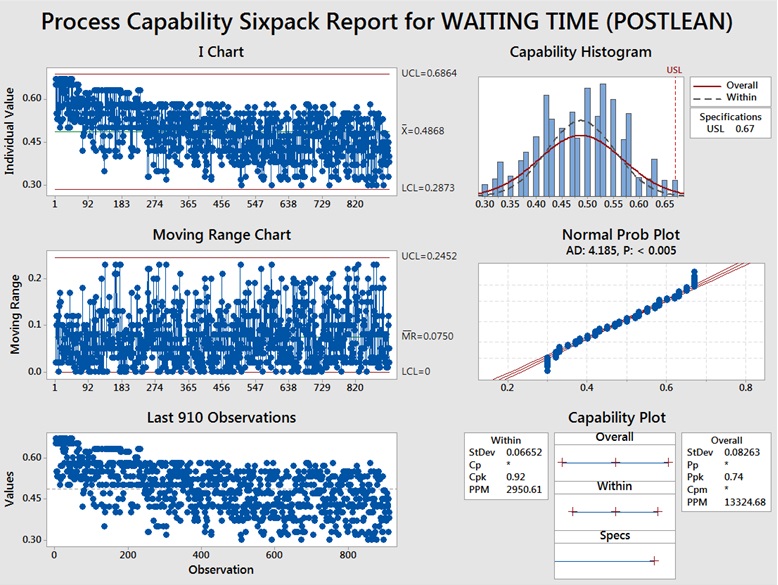
Process Capability Sixpack Report for WAITING TIME (POSTLEAN) I Chart Capability Histogram UCL=0.6864 USL Individual Value Overall 0.60 . Within Specifications X=0.4868 USL 0.67 0.45 0.30 LCL=0.2873 1 92 183 274 365 456 547 638 729 0.30 0.35 0.40 0.45 0.50 0.55 0.60 0.65 Moving Range Chart Normal Prob Plot UCL=0.2452 AD: 4.185, P:
Step by Step Solution
There are 3 Steps involved in it

Get step-by-step solutions from verified subject matter experts