

Question: Hello, Support Staff! Please interpret both PRE-LEAN AND POST-LEAN CHARTS.Please compare and contrast these probability plots.Do they both have normal distributions? If they both have
Hello, Support Staff!
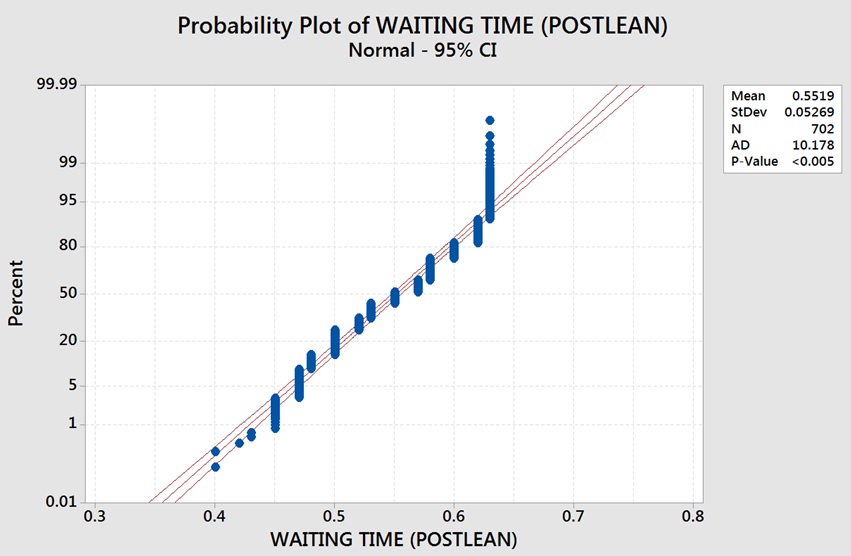
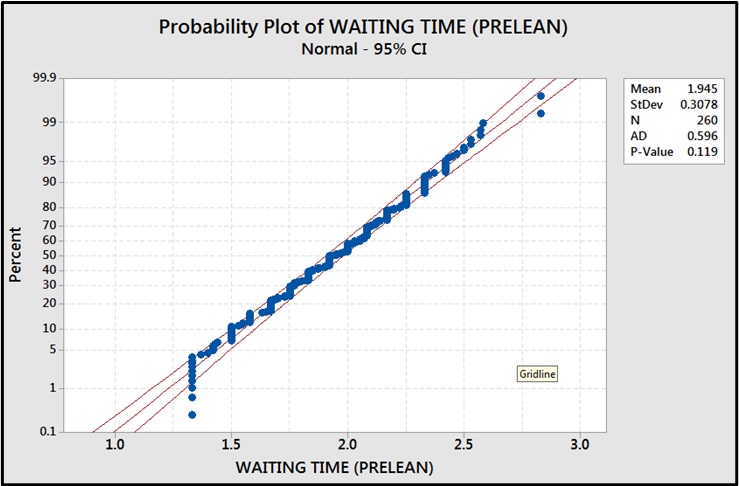
Please interpret both PRE-LEAN AND POST-LEAN CHARTS.Please compare and contrast these probability plots.Do they both have normal distributions?
If they both have normal distributions, can we use a two-sample t-test (parametric)?Or should we use a Mann-Whitney (non-parametric)?
Also, if these plots show normality, can we use Anderson-Darling (non-parametric)as well?
Please compare their P-values as well.Are they both statistically significant?
Which chart shows improvement?The Pre-lean or Post-lean?
Please explain in detail and state your conclusions.
I already attached the charts......it is in jpeg format.
Thanks for your support!
\f\f
Step by Step Solution
There are 3 Steps involved in it

Get step-by-step solutions from verified subject matter experts