

Question: This is my portfolio with 7 points plus Global Variance Minimum Portfolio. When I put them into a graph as you can see it started
This is my portfolio with 7 points plus Global Variance Minimum Portfolio. When I put them into a graph as you can see it started from reverse side I mean started from point 7 and so the shape is looking wrong. How can I fix this problem I mean it has to start from global variance p. then to point 1 and goes like this right ?. Well, this was my first question. My second question is I have found global variance portfolio by using excel solver and it seems quite right for me as the standard deviation smaller than other points but the thing is in the graph again it looks wrong I think. Should I change the weights manually ?
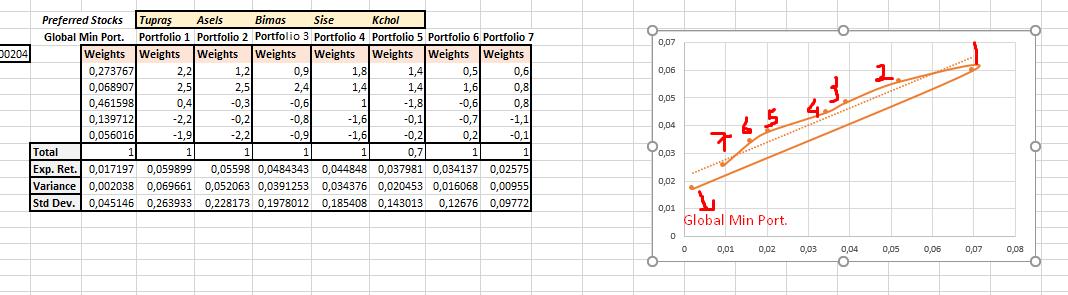
00204 Preferred Stocks Tupras Asels Bimas Sise Kchol Global Min Port. Portfolio 1 Portfolio 2 Portfolio 3 Portfolio 4 Portfolio 5 Portfolio 6 Portfolio 7 Weights Weights Weights Weights Weights Weights Weights Weights 0,273767 0,068907 0,461598 0,139712 0.056016 2,2 2,5 0,4 1 -2,2 -1,9 1 1,2 2,5 -0,3 -0,2 -0,4 -2,2 -2,2 0,9 2,4 -0,6 -0,8 -0,9 1 1,8 1,4 1 -1,6 -1,6 1 1,4 1,4 2,3 -1,8 -0,1 -0,2 0,7 0,5 1,6 -0,6 -0,7 0,2 1 0,6 0,8 0,8 -1,1 -0,1 1 Total Exp. Ret. 0,017197 0,059899 0,05598 0,0484343 0,044848 0,037981 0,034137 0,02575 Variance 0,002038 0,069661 0,052063 0,0391253 0,034376 0,020453 0,016068 0,00955 Std Dev. 0,045146 0,263933 0,228173 0,1978012 0,185408 0,143013 0,12676 0,09772 C 0,07 0,06 0,05 0,04 0,03 0,02 0,01 0 765 43 Global Min Port. 0 0,01 0,02 0,03 0,04 O 1 0,05 0,06 0,07 0,08 O
Step by Step Solution
3.40 Rating (166 Votes )
There are 3 Steps involved in it
For your first question if your graph is starting from point 7 and going backwards its likely that y... View full answer

Get step-by-step solutions from verified subject matter experts