

Question: Hello hi I have an assignment on python scripting. Can you guys plz help me, Implement a Python module to visualize the information included in
Hello hi
I have an assignment on python scripting. Can you guys plz help me,
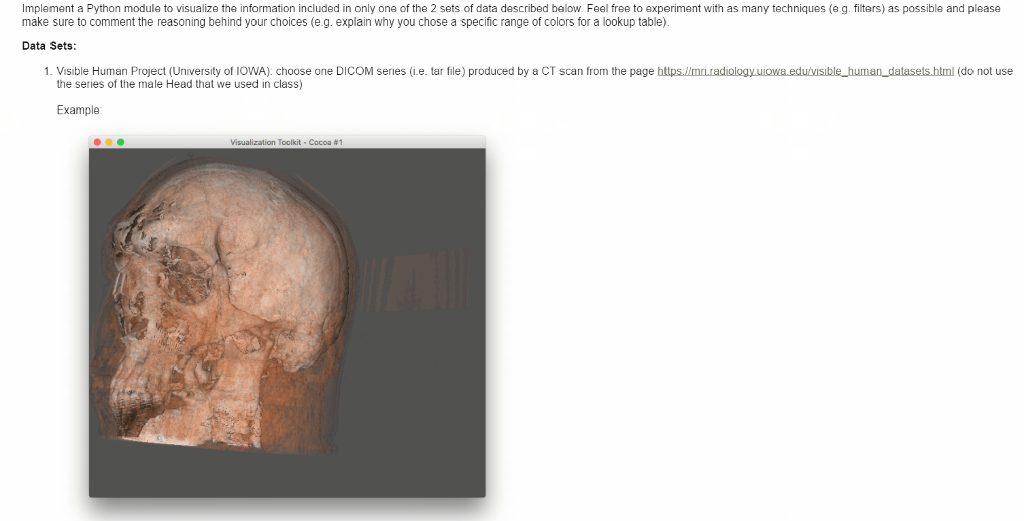
Implement a Python module to visualize the information included in only one of the 2 sets of data described below. Feel free to experiment with as many techniques (e.g. filters) as possible and please make sure to comment the reasoning behind your choices (e.g. explain why you chose a specific range of colors for a lookup table).
Data Sets: Visible Human Project (University of IOWA): choose one DICOM series (i.e. tar file) produced by a CT scan
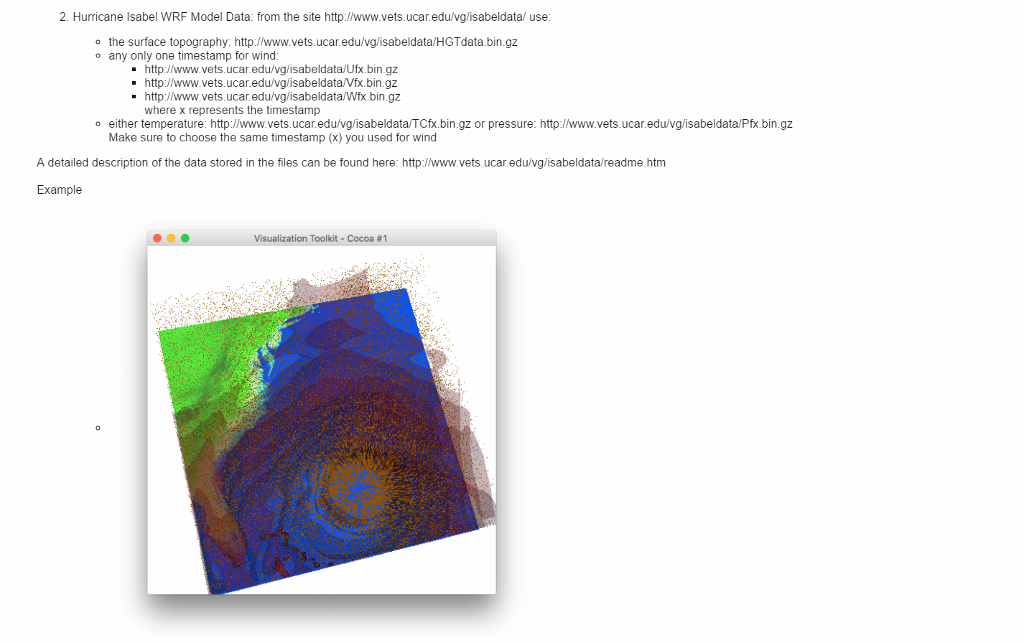
Hurricane Isabel WRF Model Data
What you need to turn in:
One Python module for either
the Visible Human Project: for this dataset, you must use at least one ColorMapping algorithm and 2 instances of a Contour algorithm or Hurricane Isabel WRF Model Data: for this dataset, you must use at least one ColorMapping algorithm and one Vector algorithm and a Contour algorithm.
I uploaded sample programs on python and these program should run JAVA platform NEON. And the ouput should be display like below pictures.
EXAMPLES:
1. Created on Jan 26, 2017 ''' import vtk from vtk.util.colors import blue cube = vtk.vtkCubeSource() cylinderMapper = vtk.vtkPolyDataMapper() cylinderMapper.SetInputConnection(cube.GetOutputPort()) cylinderActor = vtk.vtkActor() cylinderActor.SetMapper(cylinderMapper) cylinderActor.GetProperty().SetColor(blue) ren = vtk.vtkRenderer() ren.SetBackground(0.2, 0.2, 0.4) ren.AddActor(cylinderActor) renWin = vtk.vtkRenderWindow() renWin.SetWindowName("Cube") renWin.SetSize(400, 400) renWin.AddRenderer(ren) iren = vtk.vtkRenderWindowInteractor() iren.SetRenderWindow(renWin) iren.Initialize() renWin.Render() iren.Start() 2.
from VTK Python Examples (kitware) ''' import vtk import random # points in the structured grid nx = 10 ny = 5 nz = 5 # creating the structured grid scalars = vtk.vtkIntArray() for z in range(0, nz): for y in range(0, ny): for x in range(0, nx): if x 2. Hurricane Isabel WRF Model Data: from the site http:/www.vets.ucareduNg/isabeldata/ use o the surface topography: http://www.vets.ucar.edu/vglisabeldata/HGTdata.bin.gz o any only one timestamp for wind: http://www.vets.ucar.edu/vg/isabeldata/Ufx.bin.gz http://www.vets.ucar.edu/vg/isabeldata/Vfx.bin.gz http://www.vets.ucar.eduNg/isabeldata/Wfx.bin.gz where x represents the timestamp o either temperature: http://www.vets.ucaredu/vg/isabeldataTCfx.bin.gz or pressure: http://www.vets.ucar.edu/vgisabeldataPfx.bin.gz Make sure to choose the same timestamp (x) you used for wind A detailed description of the data stored in the files can be found here: http://www.vets.ucar.edu/vg/isabeldata/readme.htm Example Visualization Toolkit Cocoa B1
Step by Step Solution
There are 3 Steps involved in it

Get step-by-step solutions from verified subject matter experts