

Question: Hello, How do I calculate all the values for my data using the information on the top left of the spreadsheet? There's more interplay between
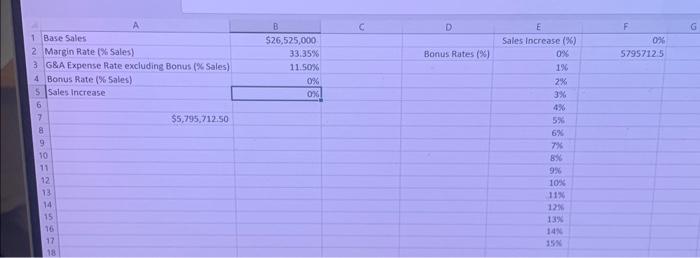
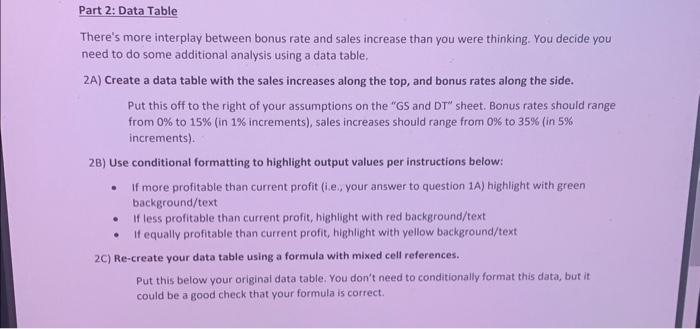
There's more interplay between bonus rate and sales increase than you were thinking. You decide you need to do some additional analysis using a data table. 2A) Create a data table with the sales increases along the top, and bonus rates along the side. Put this off to the right of your assumptions on the "GS and DT" sheet. Bonus rates should range from 0% to 15% (in 1% increments), sales increases should range from 0% to 35% (in 5% increments). 2B) Use conditional formatting to highlight output values per instructions below: - If more profitable than current profit (i.e, your answer to question 1A) highlight with green background/text - If less profitable than current profit, highlight with red background/text - It equally profitable than current profit, highlight with yellow background/text 2C) Re-create your data table using a formula with mixed cell references. Put this below your original data table. You don't need to conditionally format this data, but it could be a good check that your formula is correct
Step by Step Solution
There are 3 Steps involved in it

Get step-by-step solutions from verified subject matter experts