

Question: begin{tabular}{|c|c|c|c|c|} hline multicolumn{1}{|c|}{ Base sales } & Margin Rate (% Sales) & G&A Expense Rate excluding Bonus (% Sales) & Bonus Rate (to begin) &
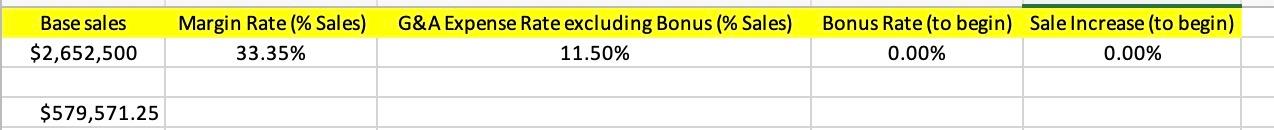
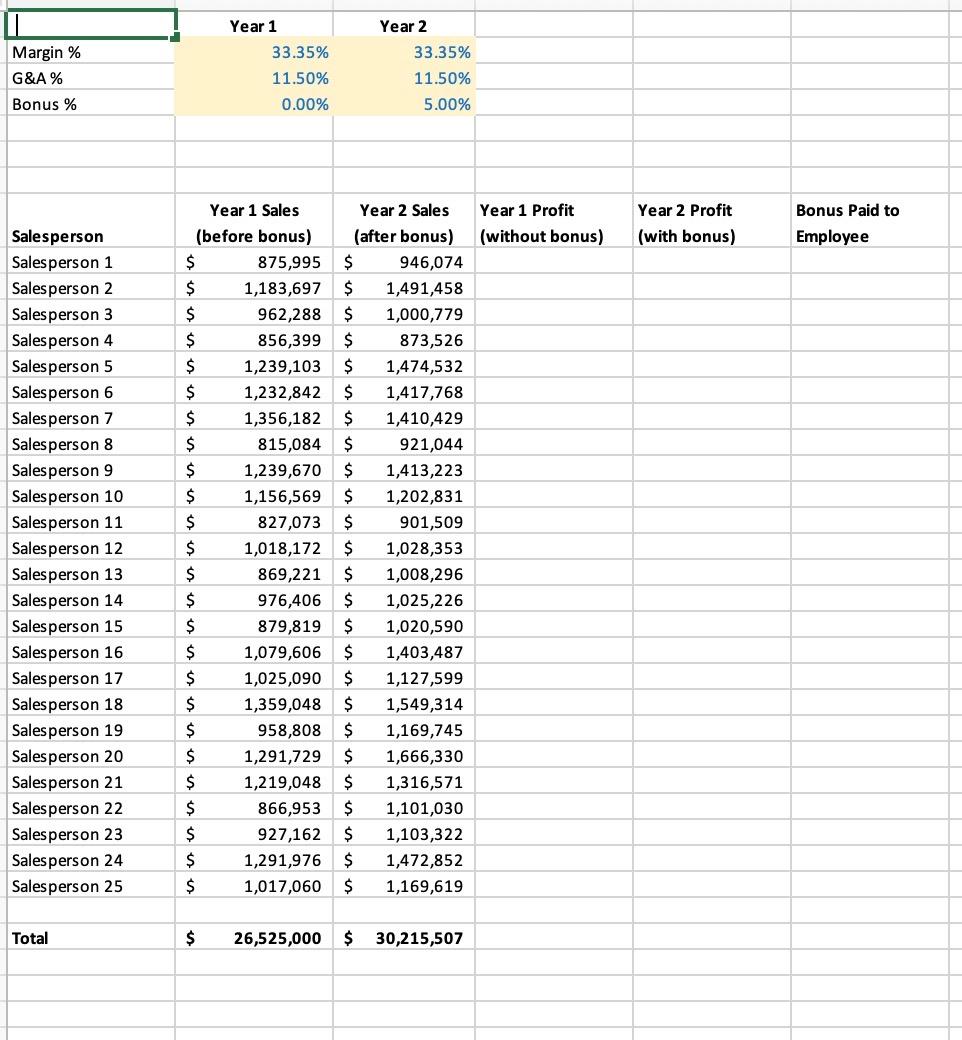
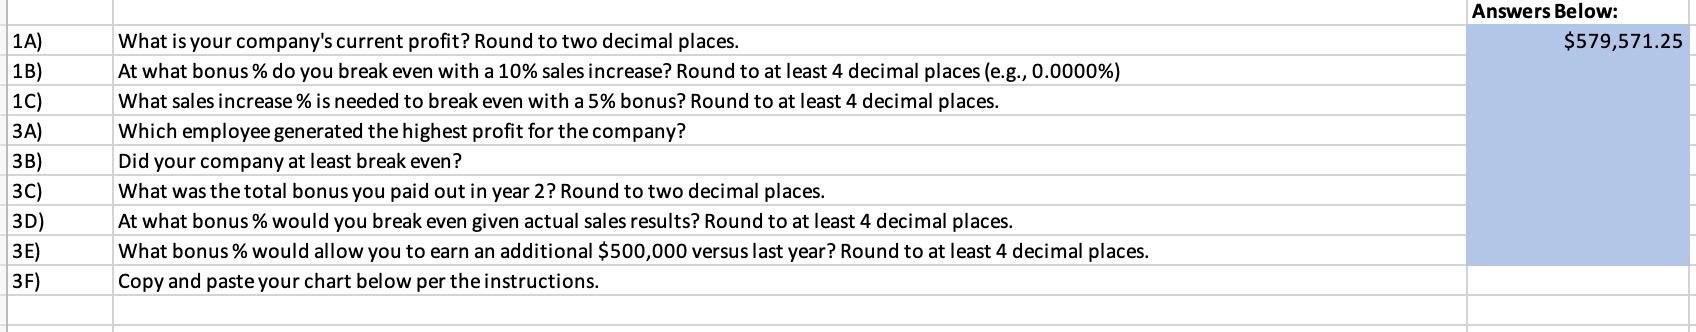
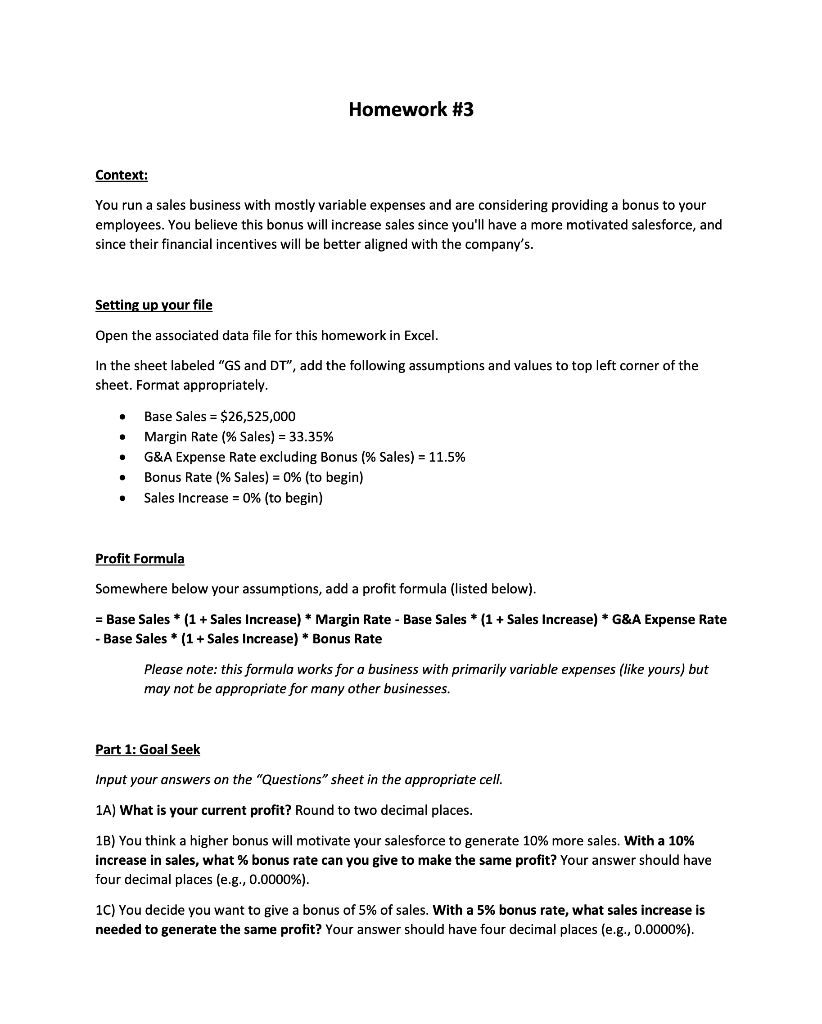
\begin{tabular}{|c|c|c|c|c|} \hline \multicolumn{1}{|c|}{ Base sales } & Margin Rate (\% Sales) & G\&A Expense Rate excluding Bonus (\% Sales) & Bonus Rate (to begin) & Sale Increase (to begin) \\ \hline$2,652,500 & 33.35% & 11.50% & 0.00% & 0.00% \\ \hline$579,571.25 & & & \\ \hline \end{tabular} \begin{tabular}{|lr|r|} \hline & Year 1 & \multicolumn{1}{c|}{ Year 2 } \\ \hline Margin \% & 33.35% & 33.35% \\ \hline G\&A \% & 11.50% & 11.50% \\ \hline Bonus \% & 0.00% & 5.00% \\ \hline \end{tabular} \begin{tabular}{|l|r|r|rr|} \hline Salesperson & \multicolumn{1}{|c|}{Year1Sales(beforebonus)} & \multicolumn{2}{c|}{Year2Sales(afterbonus)} \\ \hline Salesperson 1 & $ & 875,995 & $ & 946,074 \\ \hline Salesperson 2 & $ & 1,183,697 & $ & 1,491,458 \\ \hline Salesperson 3 & $ & 962,288 & $ & 1,000,779 \\ \hline Salesperson 4 & $ & 856,399 & $ & 873,526 \\ \hline Salesperson 5 & $ & 1,239,103 & $ & 1,474,532 \\ \hline Salesperson 6 & $ & 1,232,842 & $ & 1,417,768 \\ \hline Salesperson 7 & $ & 1,356,182 & $ & 1,410,429 \\ \hline Salesperson 8 & $ & 815,084 & $ & 921,044 \\ \hline Salesperson 9 & $ & 1,239,670 & $ & 1,413,223 \\ \hline Salesperson 10 & $ & 1,156,569 & $ & 1,202,831 \\ \hline Salesperson 11 & $ & 827,073 & $ & 901,509 \\ \hline Salesperson 12 & $ & 1,018,172 & $ & 1,028,353 \\ \hline Salesperson 13 & $ & 869,221 & $ & 1,008,296 \\ \hline Salesperson 14 & $ & 976,406 & $ & 1,025,226 \\ \hline Salesperson 15 & $ & 879,819 & $ & 1,020,590 \\ \hline Salesperson 16 & $ & 1,079,606 & $ & 1,403,487 \\ \hline Salesperson 17 & $ & 1,025,090 & $ & 1,127,599 \\ \hline Salesperson 18 & $ & 1,359,048 & $ & 1,549,314 \\ \hline Salesperson 19 & $ & 958,808 & $ & 1,169,745 \\ \hline Salesperson 20 & $ & 1,291,729 & $ & 1,666,330 \\ \hline Salesperson 21 & $ & 1,219,048 & $ & 1,316,571 \\ \hline Salesperson 22 & $ & 866,953 & $ & 1,101,030 \\ \hline Salesperson 23 & $ & 927,162 & $ & 1,103,322 \\ \hline Salesperson 24 & $ & 1,291,976 & $ & 1,472,852 \\ \hline Salesperson 25 & $ & 1,017,060 & $ & 1,169,619 \\ \hline & & & & \\ \hline \end{tabular} Total$26,525,000$30,215,507 Answers Below: \begin{tabular}{|l|l|} \hline 1A) & What is your company's current profit? Round to two decimal places. \\ \hline 1B) & At what bonus \% do you break even with a 10% sales increase? Round to at least 4 decimal places (e.g., 0.0000%) \\ \hline 1C) & What sales increase \% is needed to break even with a 5% bonus? Round to at least 4 decimal places. \\ \hline 3A) & Which employee generated the highest profit for the company? \\ \hline 3B) & Did your company at least break even? \\ \hline 3C) & What was the total bonus you paid out in year 2 ? Round to two decimal places. \\ \hline 3D) & At what bonus \% would you break even given actual sales results? Round to at least 4 decimal places. \\ \hline 3E) & What bonus % would allow you to earn an additional $500,000 versus last year? Round to at least 4 decimal places. \\ \hline 3F) & Copy and pasteyour chart below per the instructions. \\ \hline \end{tabular} Context: You run a sales business with mostly variable expenses and are considering providing a bonus to your employees. You believe this bonus will increase sales since you'll have a more motivated salesforce, and since their financial incentives will be better aligned with the company's. Setting up your file Open the associated data file for this homework in Excel. In the sheet labeled "GS and DT", add the following assumptions and values to top left corner of the sheet. Format appropriately. - Base Sales =$26,525,000 - Margin Rate (\% Sales) = 33.35\% - G\&A Expense Rate excluding Bonus (\% Sales) =11.5% - Bonus Rate (\% Sales) =0% (to begin) - Sales Increase =0% (to begin) Profit Formula Somewhere below your assumptions, add a profit formula (listed below). = Base Sales * (1 + Sales Increase ) * Margin Rate - Base Sales * (1 + Sales Increase ) * G\&A Expense Rate - Base Sales * (1+ Sales Increase) * Bonus Rate Please note: this formula works for a business with primarily variable expenses (like yours) but may not be appropriate for many other businesses. Part 1: Goal Seek Input your answers on the "Questions" sheet in the appropriate cell. 1A) What is your current profit? Round to two decimal places. 1B) You think a higher bonus will motivate your salesforce to generate 10% more sales. With a 10\% increase in sales, what \% bonus rate can you give to make the same profit? Your answer should have four decimal places (e.g., 0.0000% ). 1C) You decide you want to give a bonus of 5% of sales. With a 5% bonus rate, what sales increase is needed to generate the same profit? Your answer should have four decimal places (e.g., 0.0000\%). 2A) Create a data table with the sales increases along the top, and bonus rates along the side. Put this off to the right of your assumptions on the "GS and DT" sheet. Bonus rates should range from 0% to 15% (in 1% increments), sales increases should range from 0% to 35% (in 5% increments). 2B) Use conditional formatting to highlight output values per instructions below: - If more profitable than current profit (i.e., your answer to question 1A ) highlight with green background/text - If less profitable than current profit, highlight with red background/text - If equally profitable than current profit, highlight with yellow background/text 2C) Re-create your data table using a formula with mixed cell references. Put this below your original data table. You don't need to conditionally format this data, but it could be a good check that your formula is correct. Part 3: Analysis Flash forward. A year has now passed since you implemented a new bonus program at 5% of sales. You'd like to analyze whether this was profitable for your company. You have a list of your salespeople, the sales they generated before and after the bonus policy was implemented ("By Salesperson" sheet). Input your answers to the questions below into the appropriate cell on the "Questions" sheet. 3A) Calculate your profit each year by employee, assuming the margin \% and G\&A expense % at the top of the sheet applies to all employees equally. Be careful to not double count the bonus expensel Sum up profit for each year. Which salesperson generated the highest profit for the company? Toggle your answer to the appropriate salesperson in the "Questions" sheet. 3B) Was this a good decision? Did you at least break even? Toggle your answer to "Yes" or "No" in the "Questions" sheet. 3C) Calculate the bonus earned by each employee. What was the total bonus you paid in year 2? 3D) At what bonus \% would you break even exactly with the actual sales generated by your salespeople? Round to at least 4 decimal places. 3E) What bonus \% would allow you to earn an incremental $500,000 above last year's profit? Round to at least 4 decimal places. 3F) Using the data on the "By Salesperson" worksheet, insert a combo chart (column and line) showing Year 2 Sales and Bonus Paid by salesperson. Graph the column portion (Year 2 Sales) on the primary axis and the line portion (Bonus Paid) on the secondary axis. \begin{tabular}{|c|c|c|c|c|} \hline \multicolumn{1}{|c|}{ Base sales } & Margin Rate (\% Sales) & G\&A Expense Rate excluding Bonus (\% Sales) & Bonus Rate (to begin) & Sale Increase (to begin) \\ \hline$2,652,500 & 33.35% & 11.50% & 0.00% & 0.00% \\ \hline$579,571.25 & & & \\ \hline \end{tabular} \begin{tabular}{|lr|r|} \hline & Year 1 & \multicolumn{1}{c|}{ Year 2 } \\ \hline Margin \% & 33.35% & 33.35% \\ \hline G\&A \% & 11.50% & 11.50% \\ \hline Bonus \% & 0.00% & 5.00% \\ \hline \end{tabular} \begin{tabular}{|l|r|r|rr|} \hline Salesperson & \multicolumn{1}{|c|}{Year1Sales(beforebonus)} & \multicolumn{2}{c|}{Year2Sales(afterbonus)} \\ \hline Salesperson 1 & $ & 875,995 & $ & 946,074 \\ \hline Salesperson 2 & $ & 1,183,697 & $ & 1,491,458 \\ \hline Salesperson 3 & $ & 962,288 & $ & 1,000,779 \\ \hline Salesperson 4 & $ & 856,399 & $ & 873,526 \\ \hline Salesperson 5 & $ & 1,239,103 & $ & 1,474,532 \\ \hline Salesperson 6 & $ & 1,232,842 & $ & 1,417,768 \\ \hline Salesperson 7 & $ & 1,356,182 & $ & 1,410,429 \\ \hline Salesperson 8 & $ & 815,084 & $ & 921,044 \\ \hline Salesperson 9 & $ & 1,239,670 & $ & 1,413,223 \\ \hline Salesperson 10 & $ & 1,156,569 & $ & 1,202,831 \\ \hline Salesperson 11 & $ & 827,073 & $ & 901,509 \\ \hline Salesperson 12 & $ & 1,018,172 & $ & 1,028,353 \\ \hline Salesperson 13 & $ & 869,221 & $ & 1,008,296 \\ \hline Salesperson 14 & $ & 976,406 & $ & 1,025,226 \\ \hline Salesperson 15 & $ & 879,819 & $ & 1,020,590 \\ \hline Salesperson 16 & $ & 1,079,606 & $ & 1,403,487 \\ \hline Salesperson 17 & $ & 1,025,090 & $ & 1,127,599 \\ \hline Salesperson 18 & $ & 1,359,048 & $ & 1,549,314 \\ \hline Salesperson 19 & $ & 958,808 & $ & 1,169,745 \\ \hline Salesperson 20 & $ & 1,291,729 & $ & 1,666,330 \\ \hline Salesperson 21 & $ & 1,219,048 & $ & 1,316,571 \\ \hline Salesperson 22 & $ & 866,953 & $ & 1,101,030 \\ \hline Salesperson 23 & $ & 927,162 & $ & 1,103,322 \\ \hline Salesperson 24 & $ & 1,291,976 & $ & 1,472,852 \\ \hline Salesperson 25 & $ & 1,017,060 & $ & 1,169,619 \\ \hline & & & & \\ \hline \end{tabular} Total$26,525,000$30,215,507 Answers Below: \begin{tabular}{|l|l|} \hline 1A) & What is your company's current profit? Round to two decimal places. \\ \hline 1B) & At what bonus \% do you break even with a 10% sales increase? Round to at least 4 decimal places (e.g., 0.0000%) \\ \hline 1C) & What sales increase \% is needed to break even with a 5% bonus? Round to at least 4 decimal places. \\ \hline 3A) & Which employee generated the highest profit for the company? \\ \hline 3B) & Did your company at least break even? \\ \hline 3C) & What was the total bonus you paid out in year 2 ? Round to two decimal places. \\ \hline 3D) & At what bonus \% would you break even given actual sales results? Round to at least 4 decimal places. \\ \hline 3E) & What bonus % would allow you to earn an additional $500,000 versus last year? Round to at least 4 decimal places. \\ \hline 3F) & Copy and pasteyour chart below per the instructions. \\ \hline \end{tabular} Context: You run a sales business with mostly variable expenses and are considering providing a bonus to your employees. You believe this bonus will increase sales since you'll have a more motivated salesforce, and since their financial incentives will be better aligned with the company's. Setting up your file Open the associated data file for this homework in Excel. In the sheet labeled "GS and DT", add the following assumptions and values to top left corner of the sheet. Format appropriately. - Base Sales =$26,525,000 - Margin Rate (\% Sales) = 33.35\% - G\&A Expense Rate excluding Bonus (\% Sales) =11.5% - Bonus Rate (\% Sales) =0% (to begin) - Sales Increase =0% (to begin) Profit Formula Somewhere below your assumptions, add a profit formula (listed below). = Base Sales * (1 + Sales Increase ) * Margin Rate - Base Sales * (1 + Sales Increase ) * G\&A Expense Rate - Base Sales * (1+ Sales Increase) * Bonus Rate Please note: this formula works for a business with primarily variable expenses (like yours) but may not be appropriate for many other businesses. Part 1: Goal Seek Input your answers on the "Questions" sheet in the appropriate cell. 1A) What is your current profit? Round to two decimal places. 1B) You think a higher bonus will motivate your salesforce to generate 10% more sales. With a 10\% increase in sales, what \% bonus rate can you give to make the same profit? Your answer should have four decimal places (e.g., 0.0000% ). 1C) You decide you want to give a bonus of 5% of sales. With a 5% bonus rate, what sales increase is needed to generate the same profit? Your answer should have four decimal places (e.g., 0.0000\%). 2A) Create a data table with the sales increases along the top, and bonus rates along the side. Put this off to the right of your assumptions on the "GS and DT" sheet. Bonus rates should range from 0% to 15% (in 1% increments), sales increases should range from 0% to 35% (in 5% increments). 2B) Use conditional formatting to highlight output values per instructions below: - If more profitable than current profit (i.e., your answer to question 1A ) highlight with green background/text - If less profitable than current profit, highlight with red background/text - If equally profitable than current profit, highlight with yellow background/text 2C) Re-create your data table using a formula with mixed cell references. Put this below your original data table. You don't need to conditionally format this data, but it could be a good check that your formula is correct. Part 3: Analysis Flash forward. A year has now passed since you implemented a new bonus program at 5% of sales. You'd like to analyze whether this was profitable for your company. You have a list of your salespeople, the sales they generated before and after the bonus policy was implemented ("By Salesperson" sheet). Input your answers to the questions below into the appropriate cell on the "Questions" sheet. 3A) Calculate your profit each year by employee, assuming the margin \% and G\&A expense % at the top of the sheet applies to all employees equally. Be careful to not double count the bonus expensel Sum up profit for each year. Which salesperson generated the highest profit for the company? Toggle your answer to the appropriate salesperson in the "Questions" sheet. 3B) Was this a good decision? Did you at least break even? Toggle your answer to "Yes" or "No" in the "Questions" sheet. 3C) Calculate the bonus earned by each employee. What was the total bonus you paid in year 2? 3D) At what bonus \% would you break even exactly with the actual sales generated by your salespeople? Round to at least 4 decimal places. 3E) What bonus \% would allow you to earn an incremental $500,000 above last year's profit? Round to at least 4 decimal places. 3F) Using the data on the "By Salesperson" worksheet, insert a combo chart (column and line) showing Year 2 Sales and Bonus Paid by salesperson. Graph the column portion (Year 2 Sales) on the primary axis and the line portion (Bonus Paid) on the secondary axis
Step by Step Solution
There are 3 Steps involved in it

Get step-by-step solutions from verified subject matter experts