Question: Hello, I actually really need help with my MT217 unit 3 group assignment, where my part is about writing an assessment for profitability ratios and
Hello, I actually really need help with my MT217 unit 3 group assignment, where my part is about writing an assessment for profitability ratios and whether the company can maintain or improve profitability, based on the four profitability ratios, and the financial outcomes as positive and negative trends when all four ratio outcomes are factored as a group.
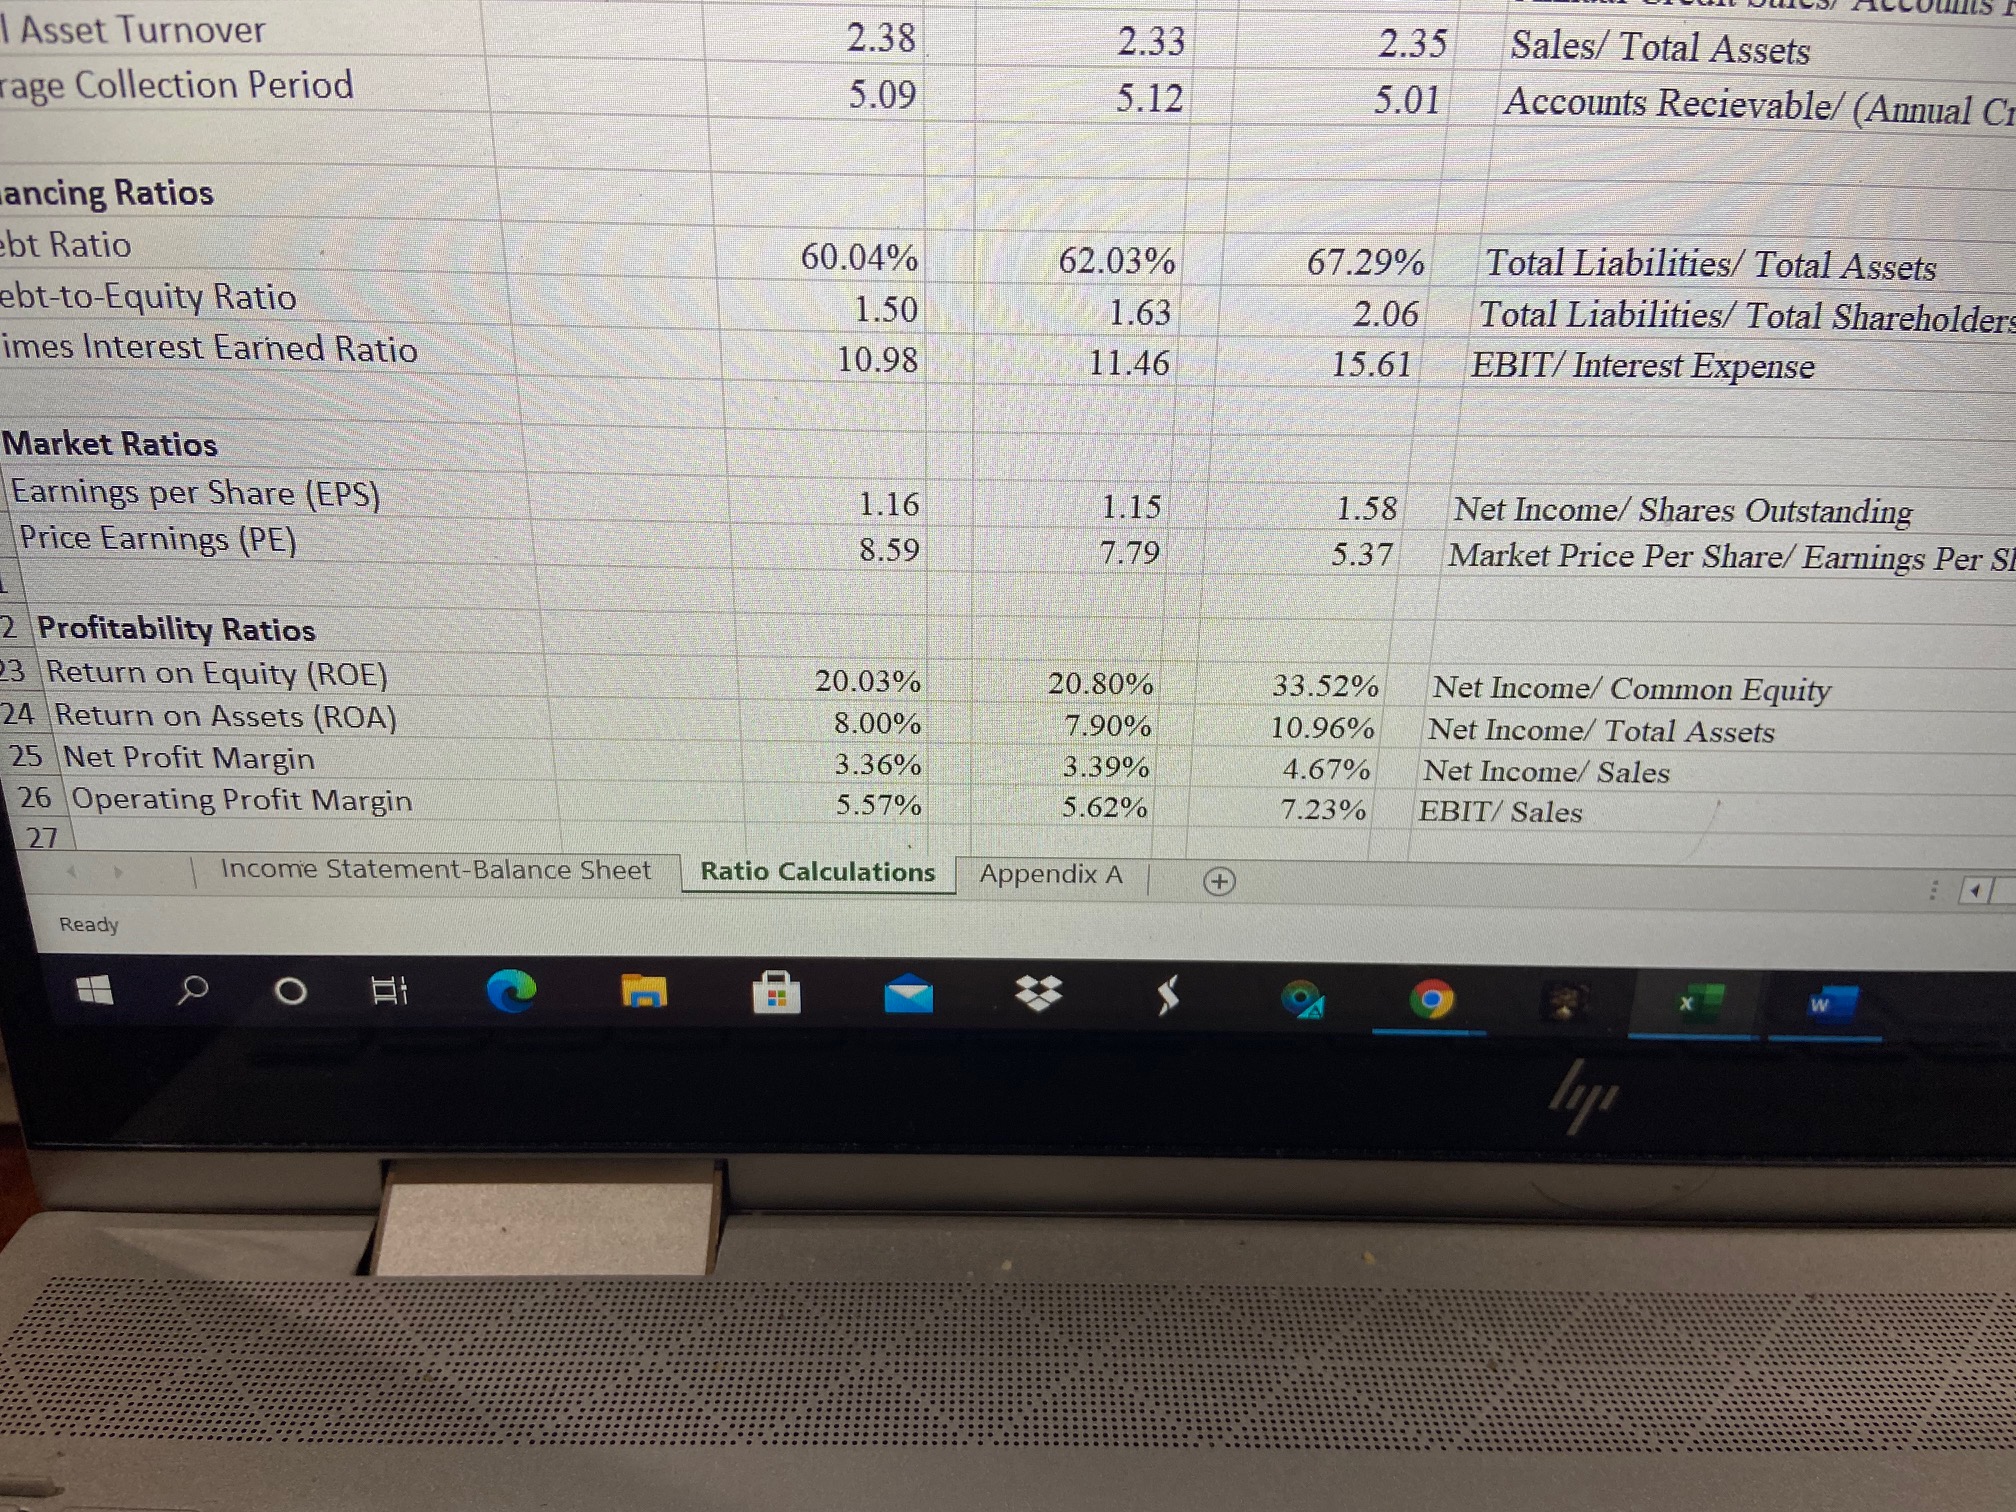
Your paper, based upon your team's collective analysis, should include a measure of and analysis of financial outcomes based on the ratios for each financial ratio classification (i.e., the liquidity classifications of ratios are based upon the quick and current ratio outcomes).
You will calculate ratios for each classification for the 3 years of data (i.e., the current ratio may have been 1.5 the first year, 1.35 the second year, and .75 in the most recent year). It is based on these results that you will measure financial performance, or trends, from one year to the next. It is imperative that the ratios-numbers, and quantitative outcomes, support your analysis.
- Using the data from the Income Statement and Balance Sheet, provide the correct calculation of the liquidity ratios and an assessment of the company's ability to maintain liquidity and the management of current assets and current liabilities. Include the proper assessment of outcomes as positive or negative trends when all ratio outcomes are factored as a group.
Liquidity Ratios
- Using the data from the Income Statement and Balance Sheet, provide the correct calculation of the activity ratios and an assessment of the company's ability to maintain liquidity. Include the proper assessment of outcomes as positive or negative trends when all four ratio outcomes are factored as a group.
Activity Ratios
- Inventory Turnover
- Accounts Receivables Turnover
- Total Asset Turnover
- Average Collection Period
- Using the data from the Income Statement and Balance Sheet, provide the correct calculation of the financing ratios. Include the proper assessment of outcomes as positive or negative trends when all three ratio outcomes are factored as a group.
Financing Ratios
- Debt Ratio
- Debt-to-Equity Ratio
- Times Interest Earned Ratio
- Using the data from the price per share data, the Income Statement, and the Balance Sheet, provide the correct calculation for the market value ratios below.
Market Value Ratios
- Earnings per Share (EPS)
- Price Earnings (PE)
- Using the data from the Income Statement and Balance Sheet, provide the correct calculation of these four profitability ratios and an assessment of the company's ability to maintain if not improve profitability based on the amounts of equity, assets, and levels of profits from sales. Include the proper assessment of outcomes as positive or negative trends when all four ratio outcomes are factored as a group.
Profitability Ratios
- Return on Equity (ROE)
- Return on Assets (ROA)
- Net Profit Margin
- Operating Profit Margin
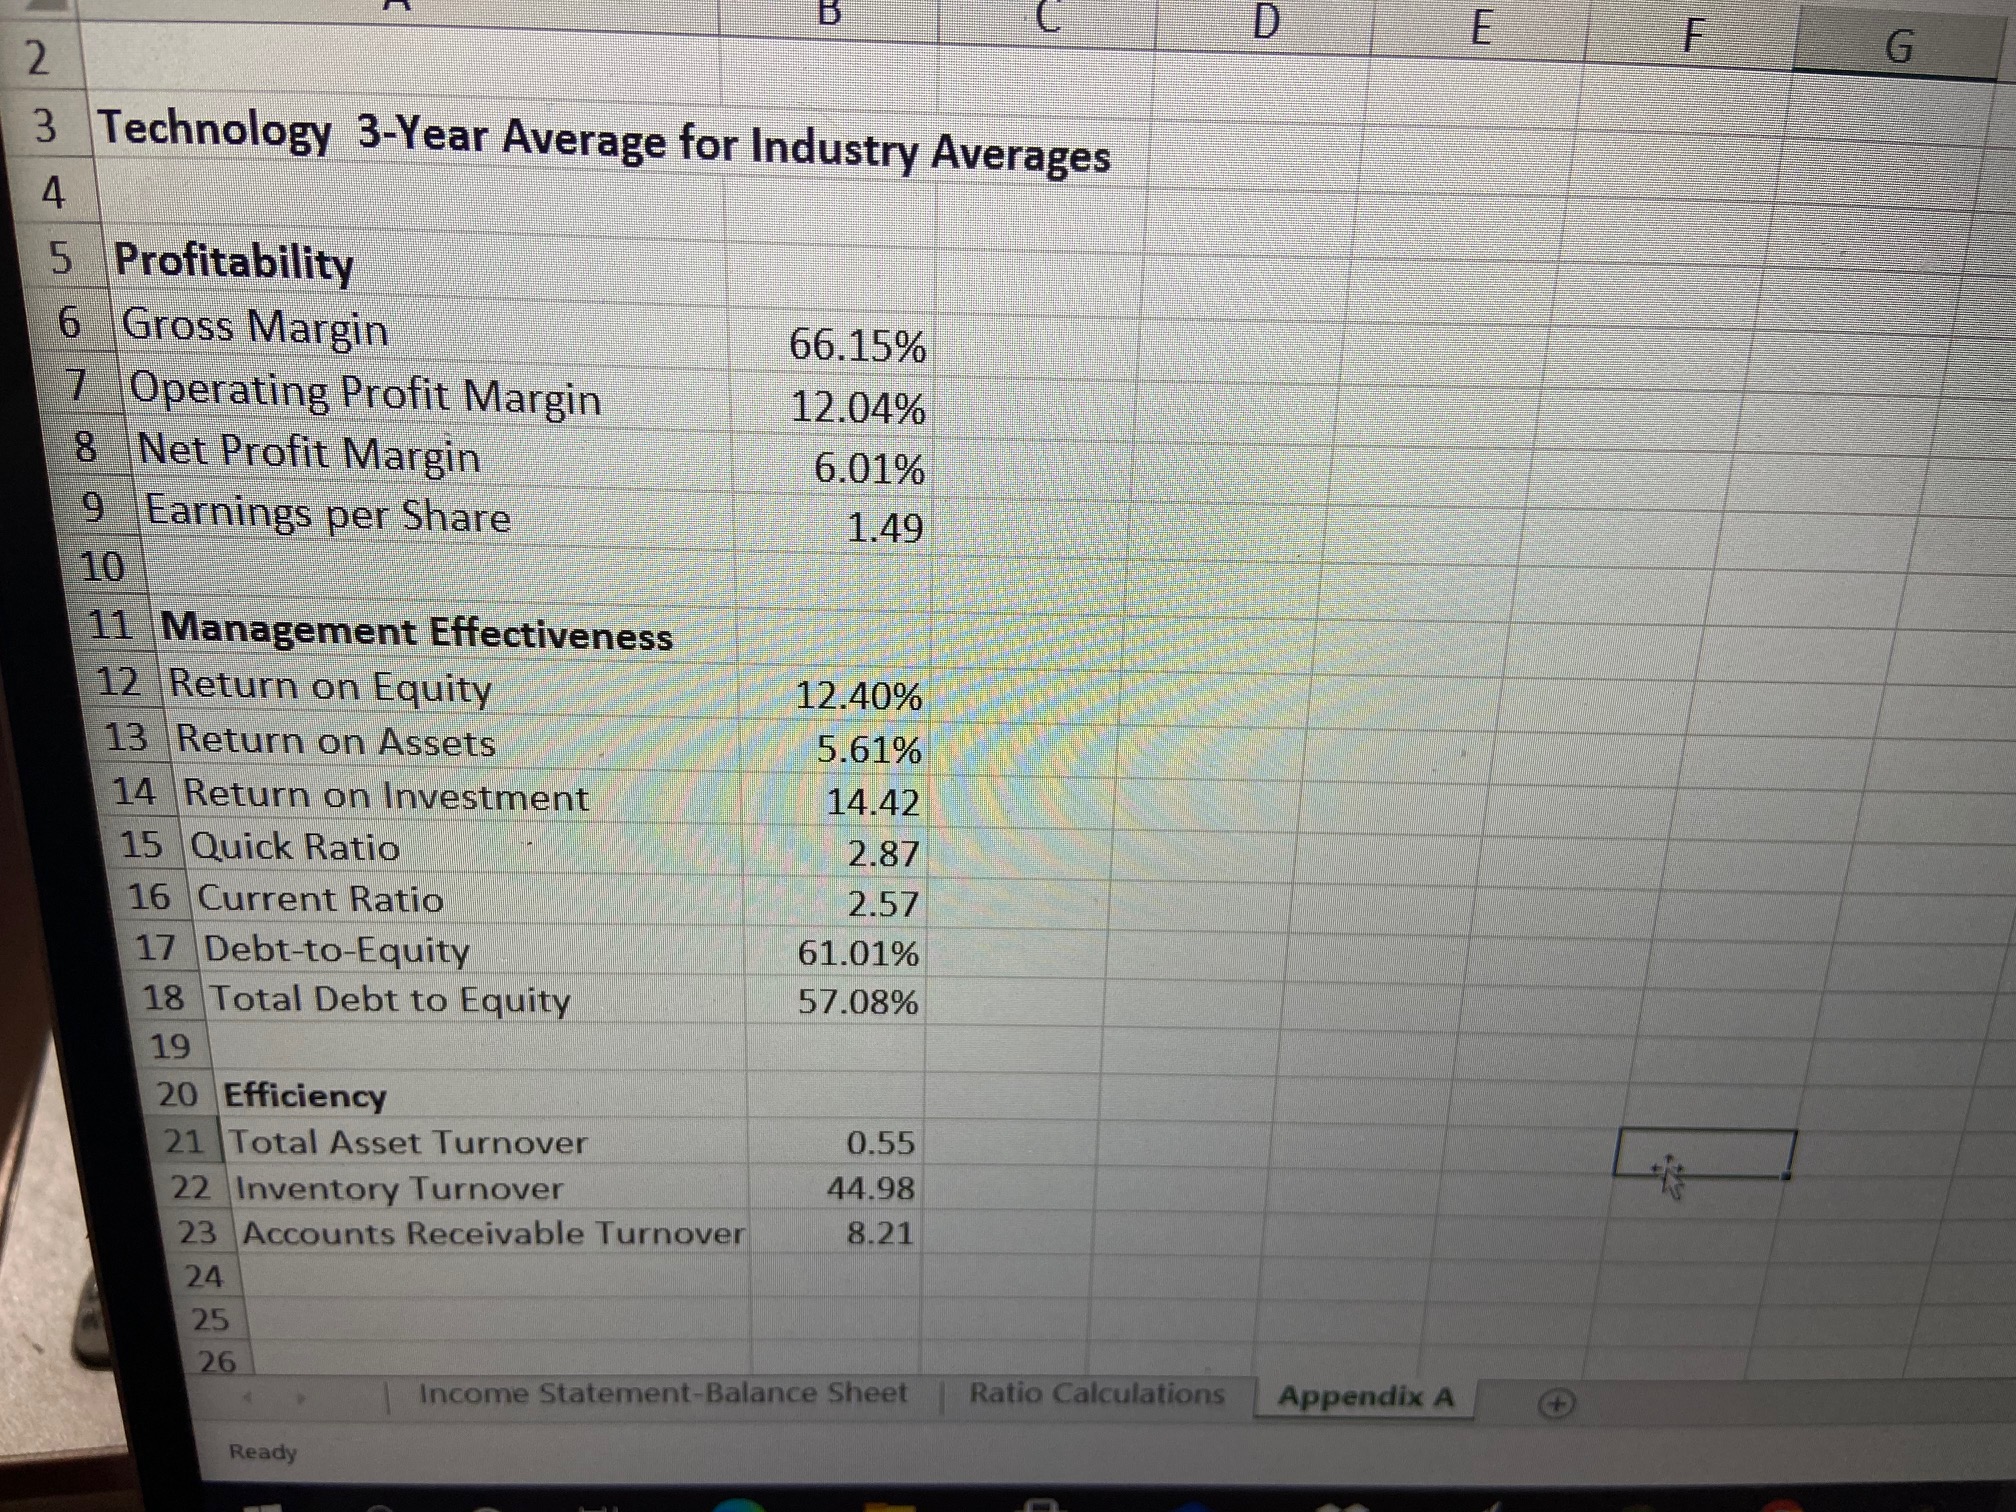
I am also sending the balance sheet, income statement, the calculations for the ratios, as well as the 3-year average for the industry average.
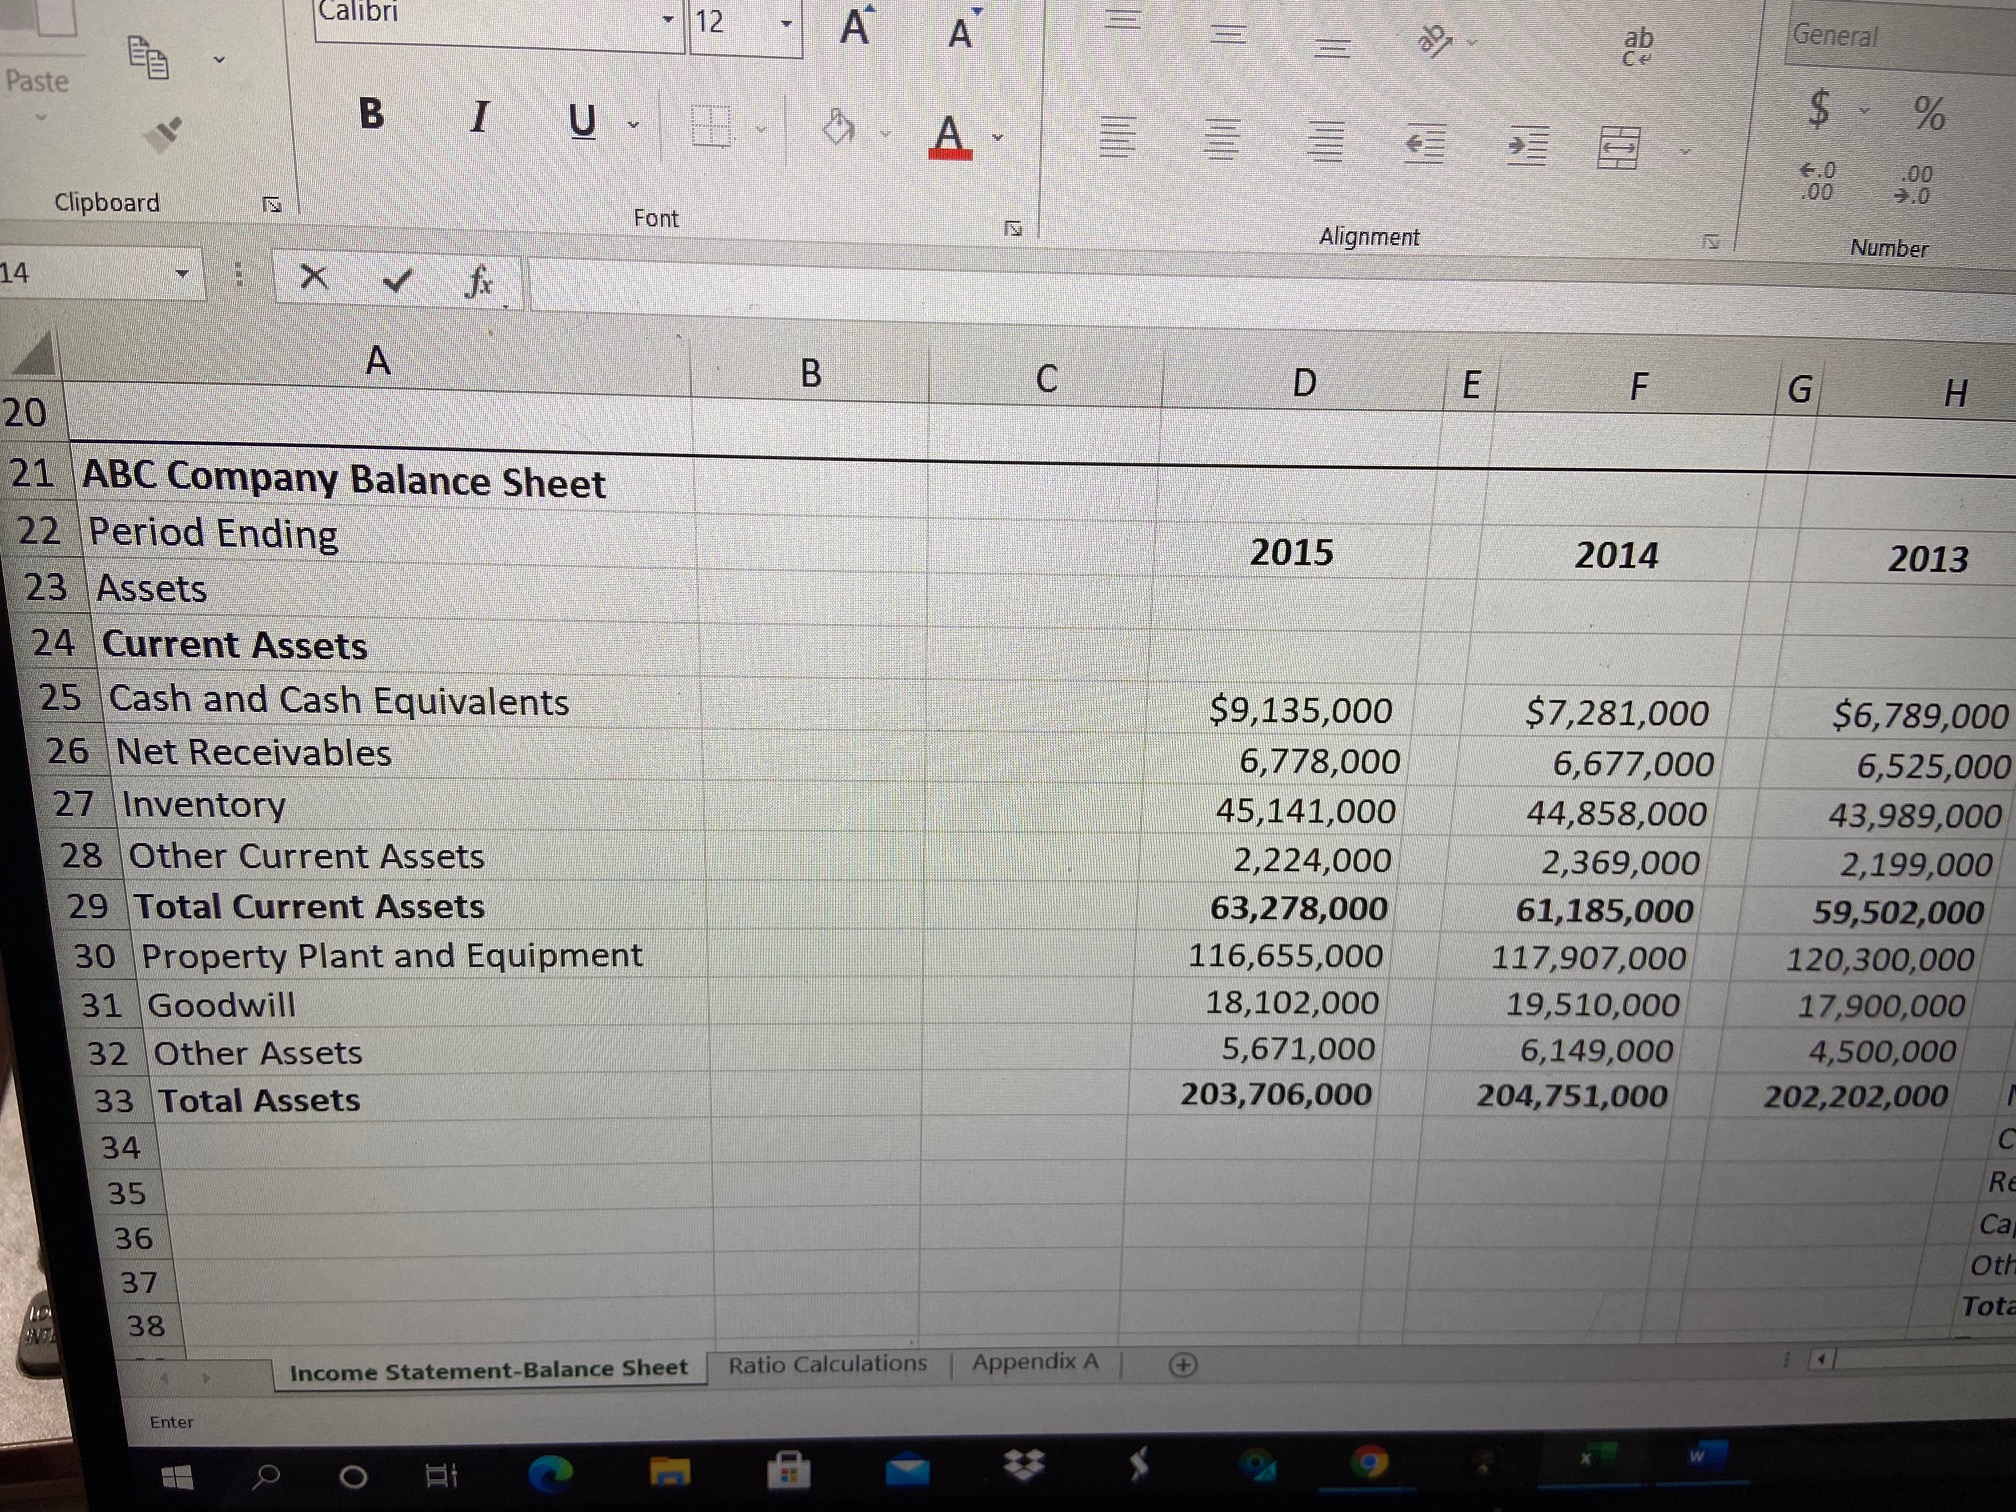
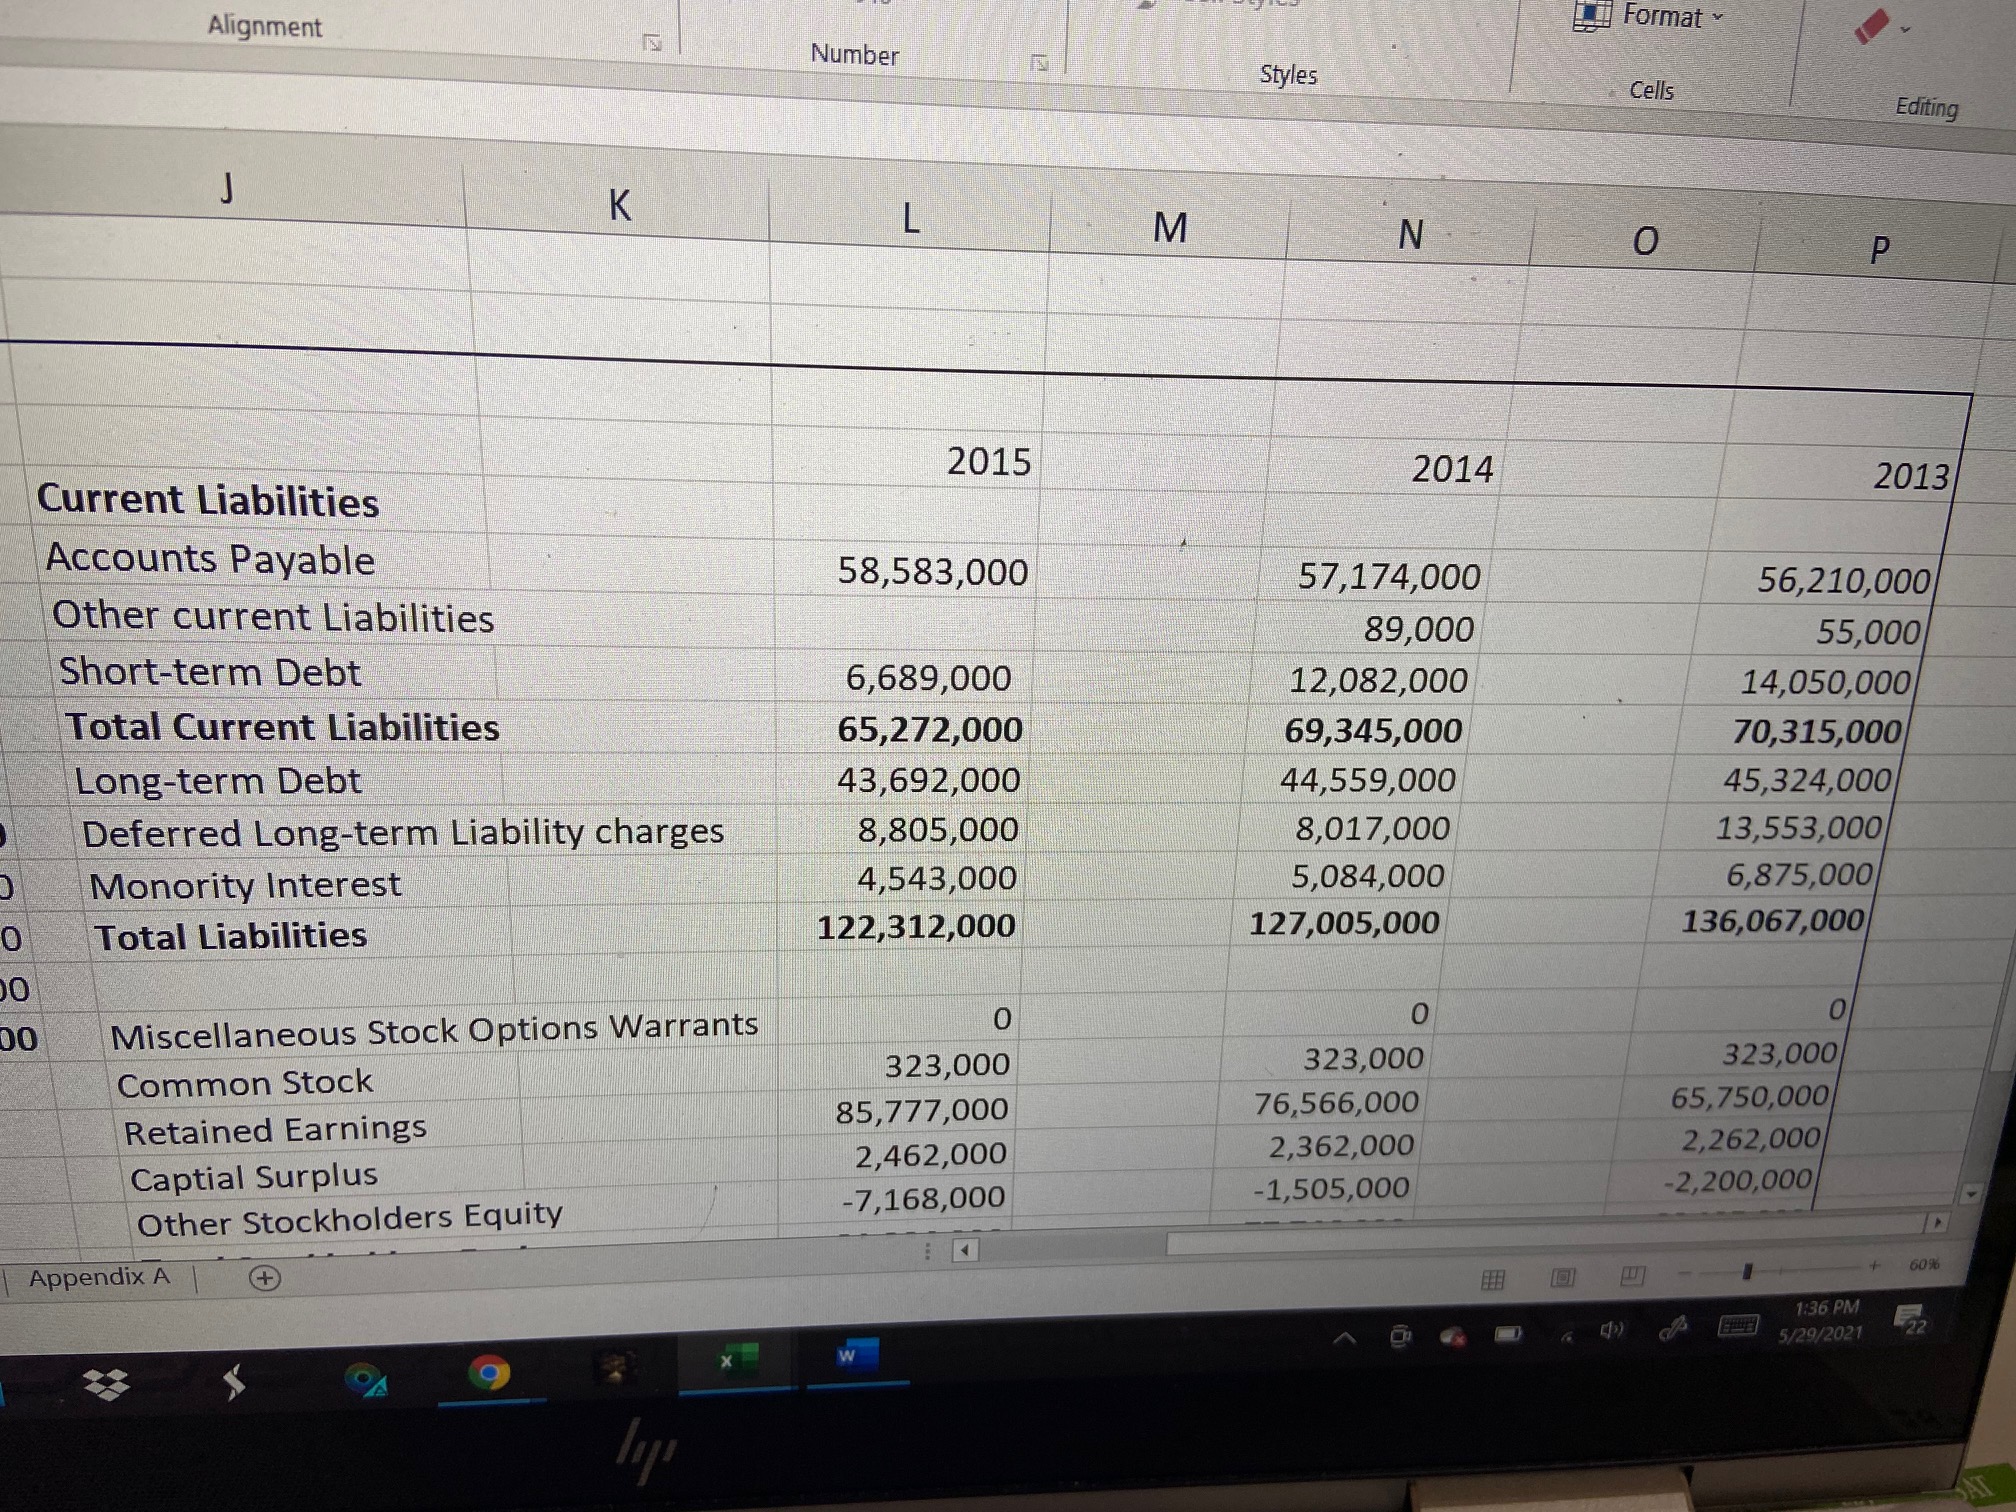
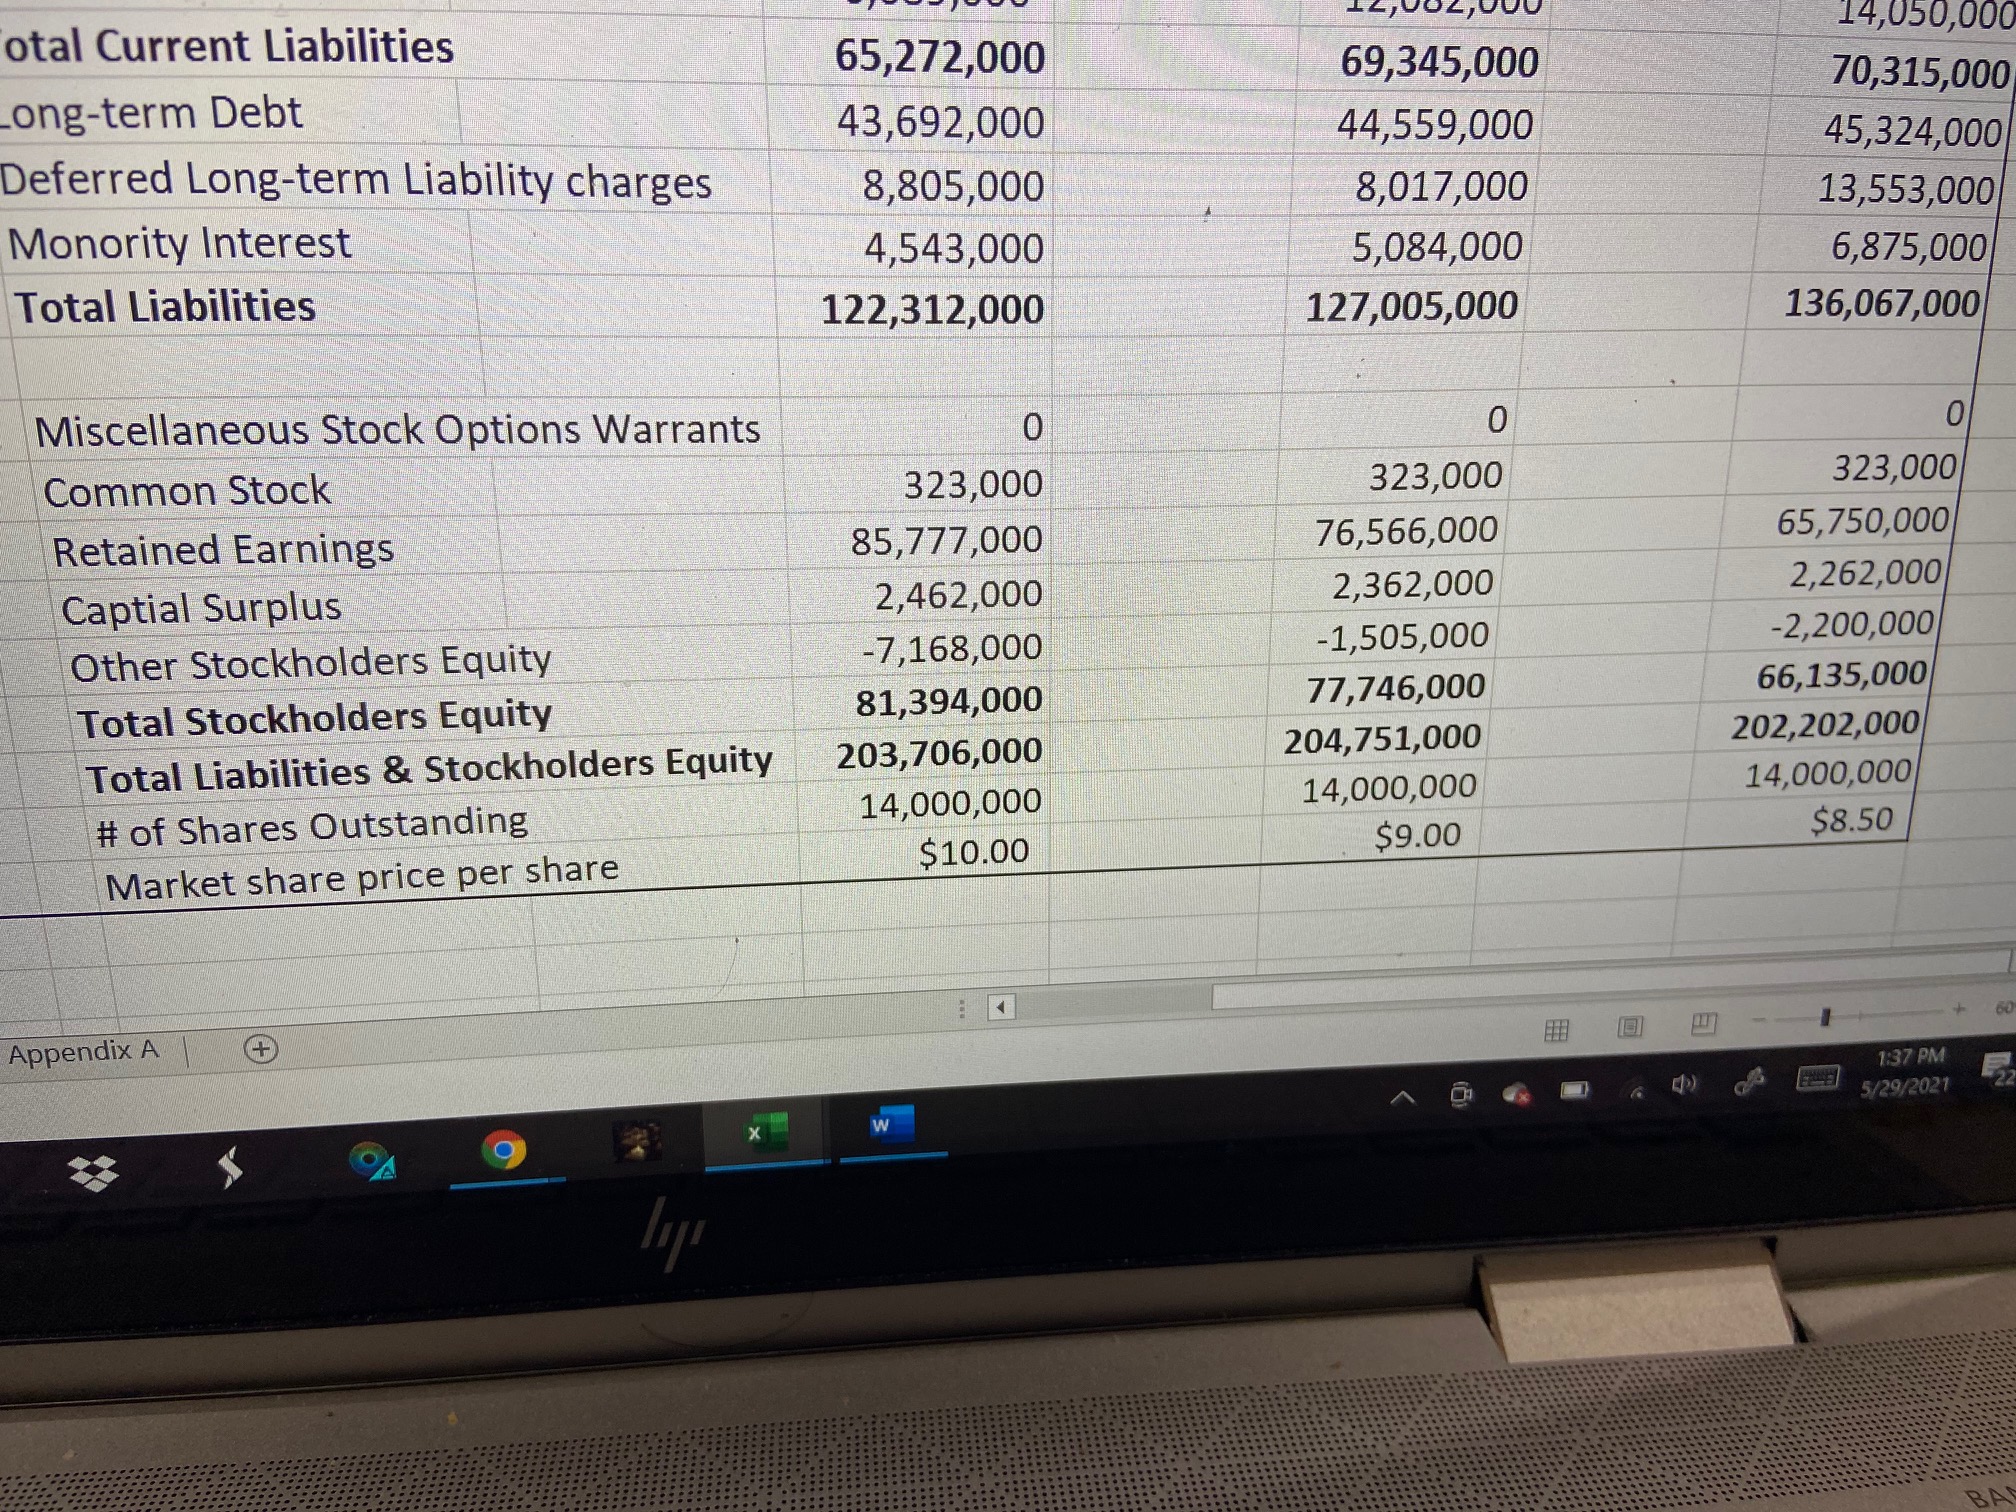
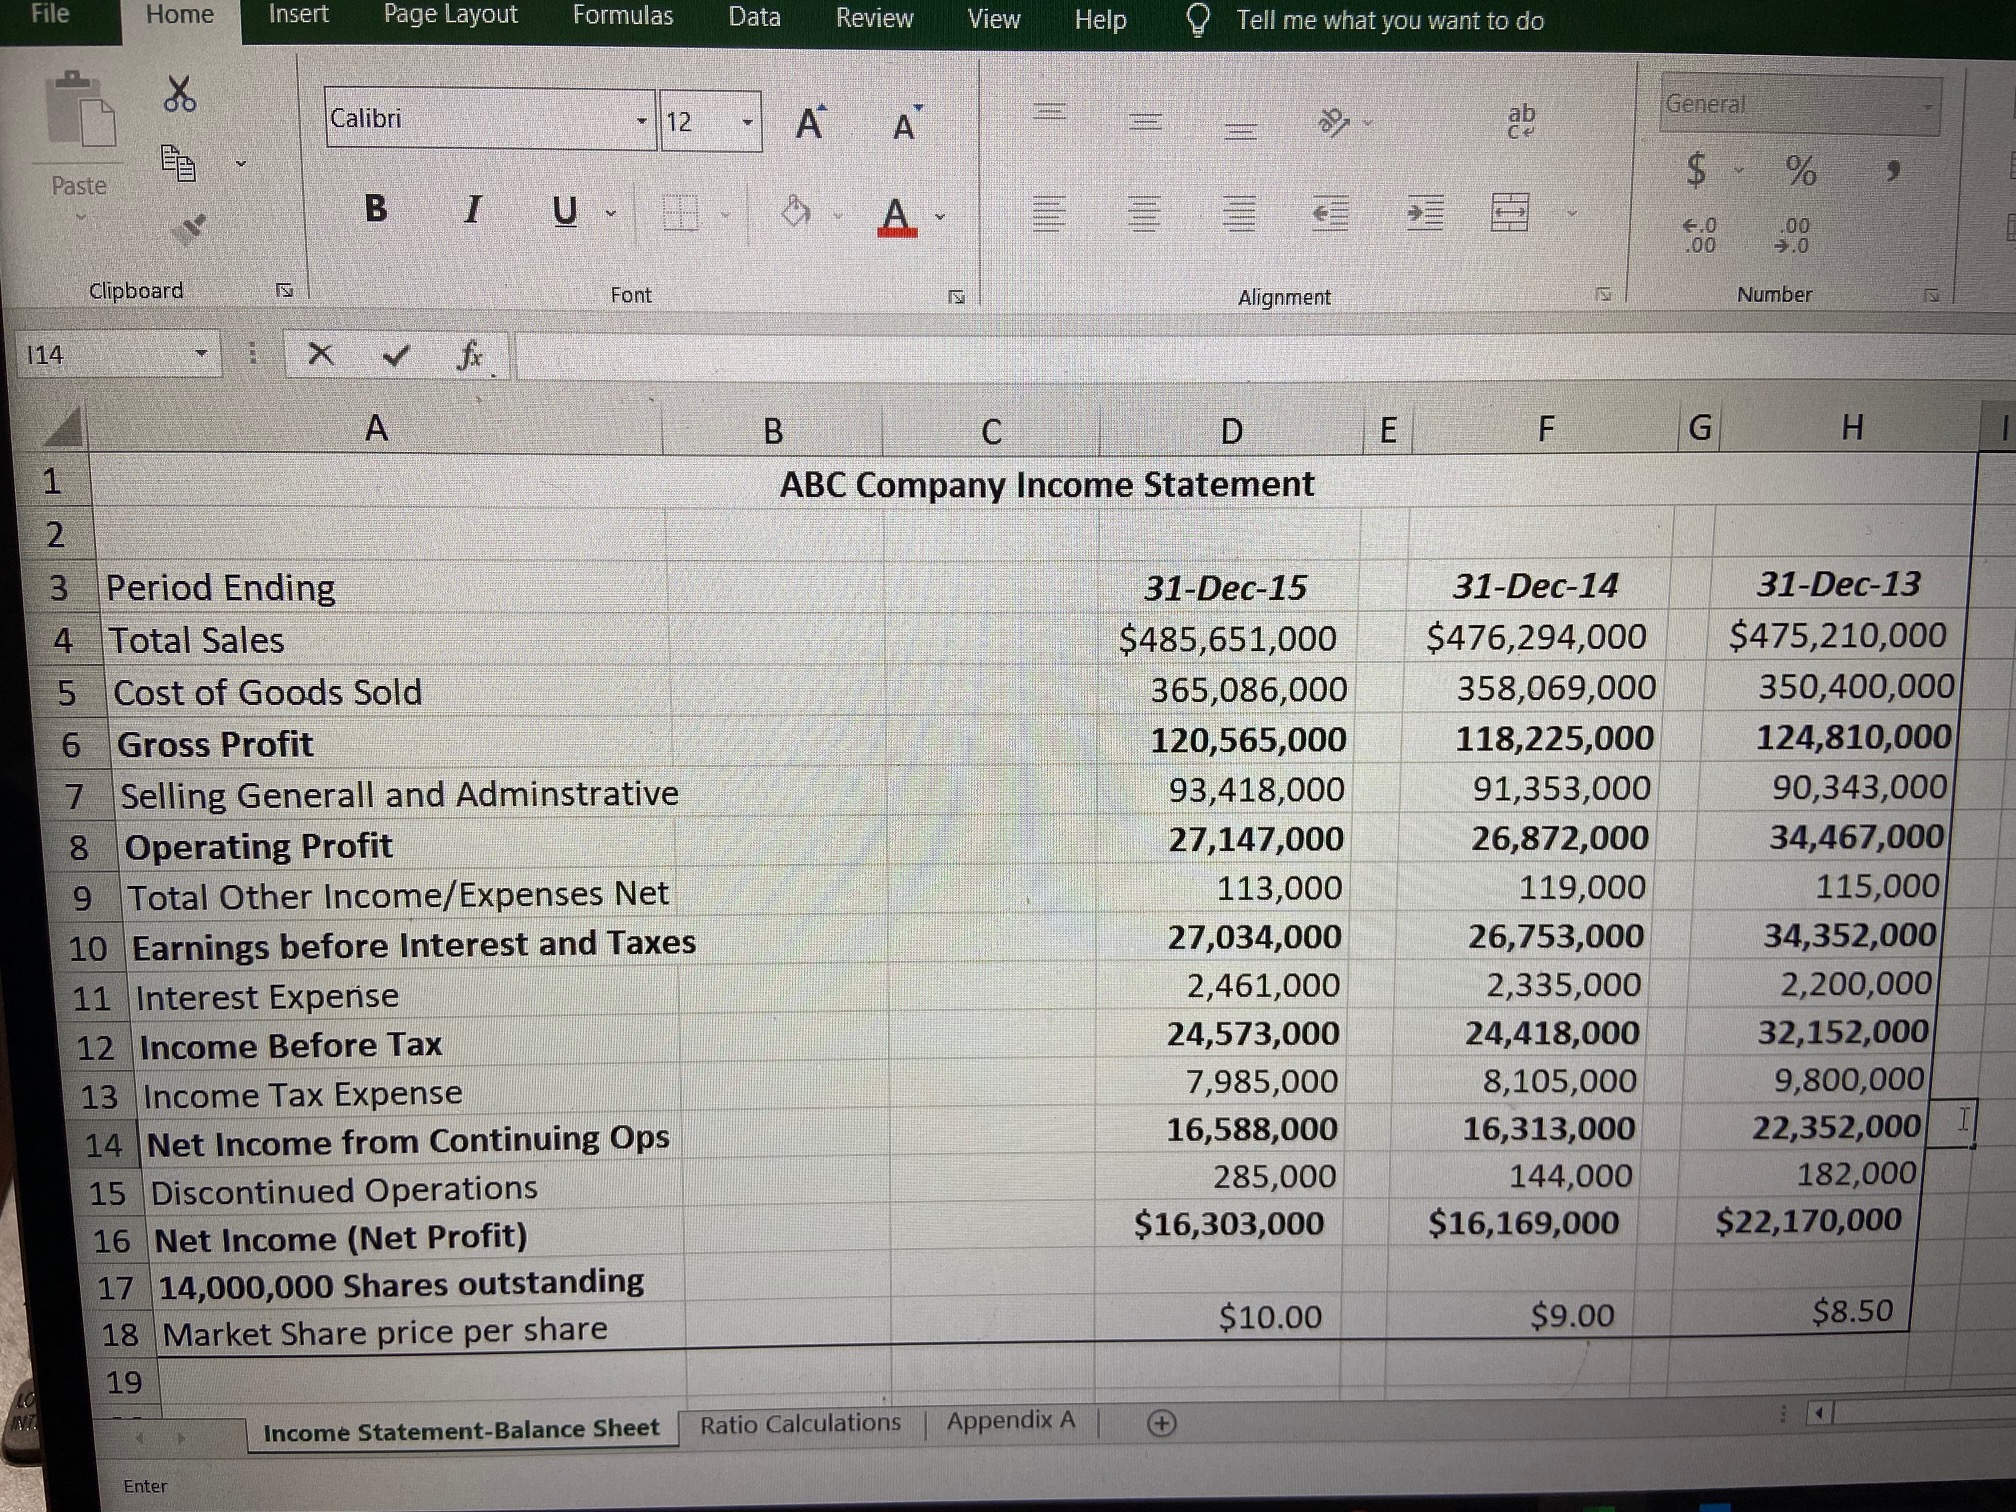
Callbri 12 A A General Paste B I U % A E E .00 00 0 Clipboard Font Alignment Number 14 X fx B C D E F G H 20 21 ABC Company Balance Sheet 22 Period Ending 2015 2014 2013 23 Assets 24 Current Assets 25 Cash and Cash Equivalents $9,135,000 $7,281,000 $6,789,000 26 Net Receivables 6,778,000 6,677,000 6,525,000 27 Inventory 45,141,000 44,858,000 43,989,000 28 Other Current Assets 2,224,000 2,369,000 2,199,000 29 Total Current Assets 63,278,000 61,185,000 59,502,000 30 Property Plant and Equipment 116,655,000 117,907,000 120,300,000 31 Goodwill 18,102,000 19,510,000 17,900,000 32 Other Assets 5,671,000 6,149,000 4,500,000 33 Total Assets 203,706,000 204,751,000 202,202,000 34 35 Ca 36 Oth 37 Tot 38 Income Statement-Balance Sheet Ratio Calculations Appendix A + Enter A 9 OAlignment ! ! Format ~ Number Styles Cells Editing K M N O P 2015 2014 Current Liabilities 2013 Accounts Payable 58,583,000 57,174,000 56,210,000 Other current Liabilities 89,000 55,000 Short-term Debt 6,689,000 12,082,000 14,050,000 Total Current Liabilities 65,272,000 69,345,000 70,315,000 Long-term Debt 43,692,000 44,559,000 45,324,000 Deferred Long-term Liability charges 8,805,000 8,017,000 13,553,000 Monority Interest 4,543,000 5,084,000 6,875,000 0 Total Liabilities 122,312,000 127,005,000 136,067,000 Miscellaneous Stock Options Warrants 0 Common Stock 323,000 323,000 323,000 85,777,000 76,566,000 65,750,000 Retained Earnings 2,462,000 2,362,000 2,262,000 Captial Surplus -1,505,000 -2,200,000 Other Stockholders Equity -7,168,000 Appendix A + 60% 1:36 PM 5/29/2021 9otal Current Liabilities 65,272,000 14,050,000 69,345,000 ong-term Debt 70,315,000 43,692,000 44,559,000 Deferred Long-term Liability charges 45,324,000 8,805,000 8,017,000 Monority Interest 13,553,000 4,543,000 5,084,000 Total Liabilities 6,875,000 122,312,000 127,005,000 136,067,000 Miscellaneous Stock Options Warrants 0 0 0 Common Stock 323,000 323,000 323,000 Retained Earnings 85,777,000 76,566,000 65,750,000 Captial Surplus 2,462,000 2,362,000 2,262,000 Other Stockholders Equity -7,168,000 -1,505,000 -2,200,000 Total Stockholders Equity 81,394,000 77,746,000 66,135,000 Total Liabilities & Stockholders Equity 203,706,000 204,751,000 202,202,000 14,000,000 14,000,000 14,000,000 # of Shares Outstanding $10.00 $8.50 Market share price per share $9.00 Appendix A 1:37 PM W 5/29/2021 9 XFile Home Insert Page Layout Formulas Data Review View Help Tell me what you want to do Calibri 12 A ab General A Paste B I U~ A 00 00 Clipboard Font Alignment Number 114 X V fx A B C D E F G H ABC Company Income Statement IN W Period Ending 31-Dec-15 31-Dec-14 31-Dec-13 4 Total Sales $485,651,000 $476,294,000 $475,210,000 5 Cost of Goods Sold 365,086,000 358,069,000 350,400,000 6 Gross Profit 120,565,000 118,225,000 124,810,000 7 Selling Generall and Adminstrative 93,418,000 91,353,000 90,343,000 8 Operating Profit 27,147,000 26,872,000 34,467,000 9 Total Other Income/Expenses Net 113,000 119,000 115,000 10 Earnings before Interest and Taxes 27,034,000 26,753,000 34,352,000 11 Interest Expense 2,461,000 2,335,000 2,200,000 12 Income Before Tax 24,573,000 24,418,000 32,152,000 13 Income Tax Expense 7,985,000 8,105,000 9,800,000 14 Net Income from Continuing Ops 16,588,000 16,313,000 22,352,000 15 Discontinued Operations 285,000 144,000 182,000 16 Net Income (Net Profit) $16,303,000 $16,169,000 $22,170,000 17 14,000,000 Shares outstanding 18 Market Share price per share $10.00 $9.00 $8.50 19 Income Statement-Balance Sheet Ratio Calculations Appendix A InterAsset Turnover 2.38 2.33 2.35 Sales/ Total Assets rage Collection Period 5.09 5.12 5.01 Accounts Recievable/ (Annual C ancing Ratios bt Ratio 60.04% 62.03% 67.29% Total Liabilities/ Total Assets ebt-to-Equity Ratio 1.50 1.63 2.06 Total Liabilities/ Total Shareholder imes Interest Earned Ratio 10.98 11.46 15.61 EBIT/ Interest Expense Market Ratios Earnings per Share (EPS) 1.16 1.15 1.58 Net Income/ Shares Outstanding Price Earnings (PE) 8.59 7.79 5.37 Market Price Per Share/ Earnings Per S 2 Profitability Ratios Return on Equity (ROE) 20.03% 20.80% 33.52% Net Income/ Common Equity 24 Return on Assets (ROA) 8.00% 7.90% 10.96% Net Income/ Total Assets 25 Net Profit Margin 3.36% 3.39% 4.67% Net Income/ Sales 26 Operating Profit Margin 5.57% 5.62% 7.23% EBIT/ Sales 27 Income Statement-Balance Sheet Ratio Calculations Appendix A + Ready O O OA WD E G 2 3 Technology 3-Year Average for Industry Averages 4 5 Profitability 6 Gross Margin 66.15% 7 Operating Profit Margin 12.04% 8 Net Profit Margin 6.01% 9 Earnings per Share 1.49 10 11 Management Effectiveness 12 Return on Equity 12.40% 13 Return on Assets 5.61% 14 Return on Investment 14.42 15 Quick Ratio 2.87 16 Current Ratio 2.57 17 Debt-to-Equity 61.01% 18 Total Debt to Equity 57.08% 19 20 Efficiency 21 Total Asset Turnover 0.55 22 Inventory Turnover 44.98 23 Accounts Receivable Turnover 8.21 24 25 26 Income Statement-Balance Sheet Ratio Calculations Appendix A Ready