

Question: Hello, i am having trouble calculating the table, some steps in how to get the table would help :) IMPORTANT NOTE: To receive full credit,
Hello, i am having trouble calculating the table, some steps in how to get the table would help :)

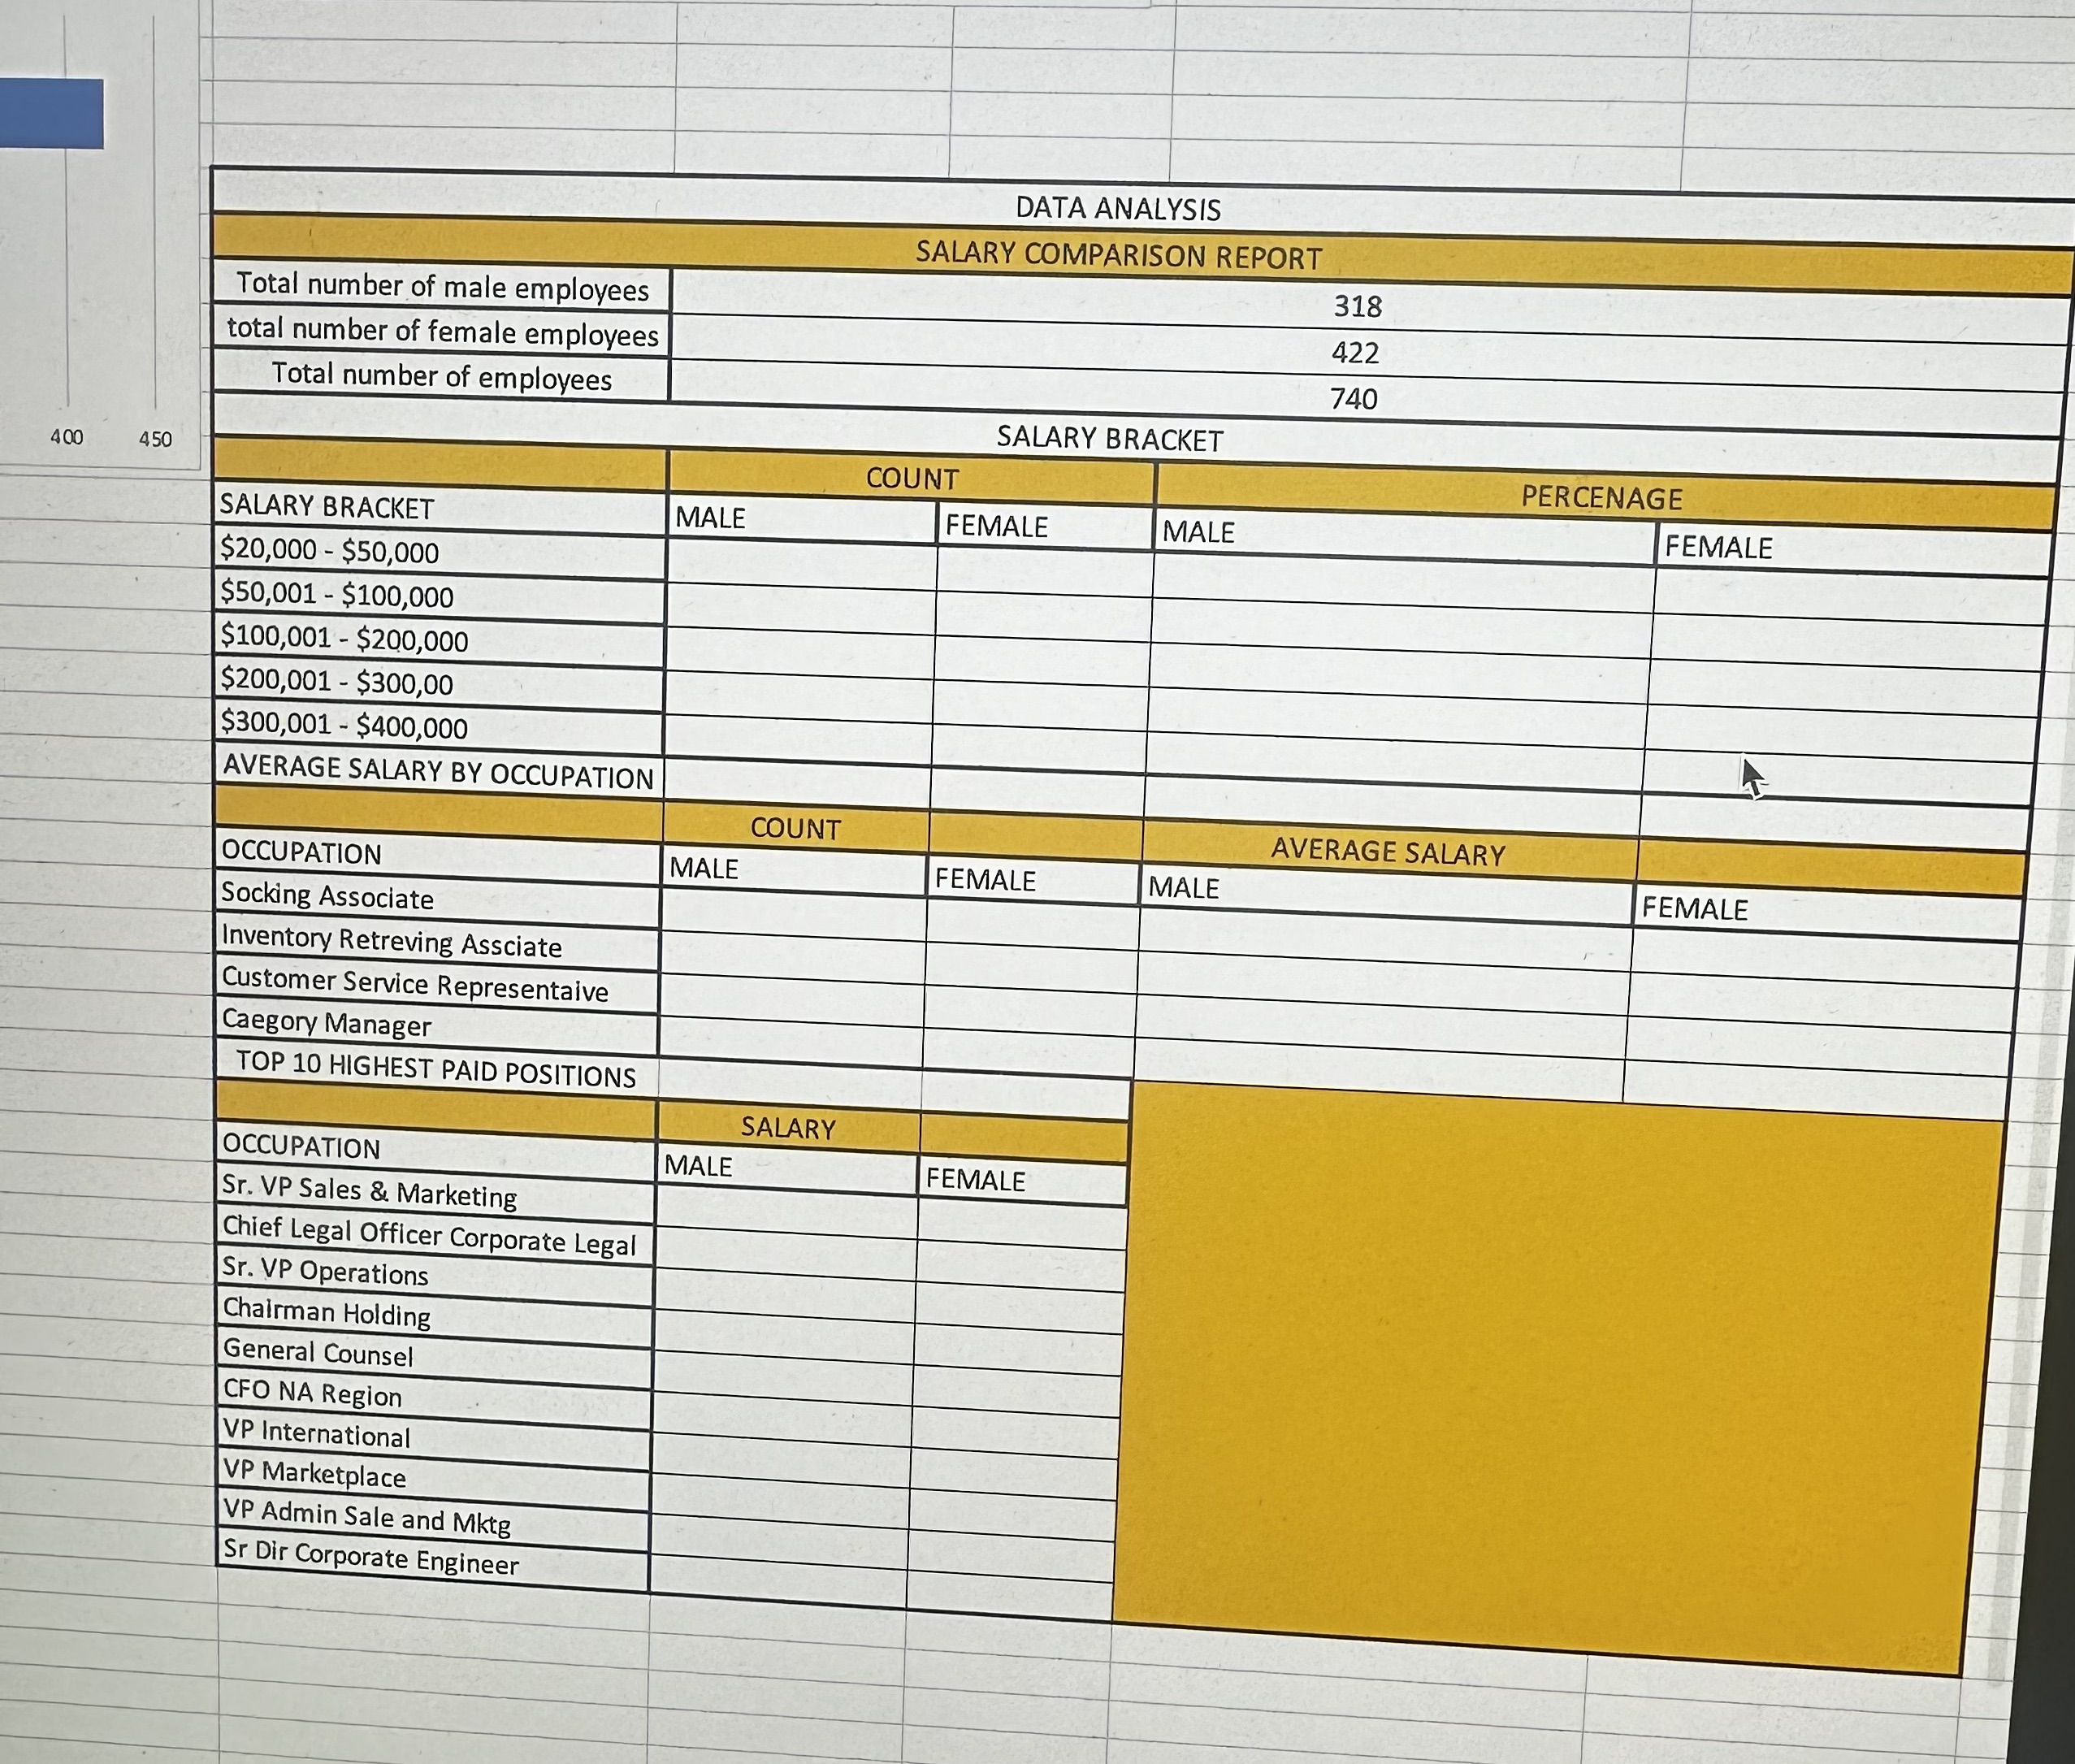
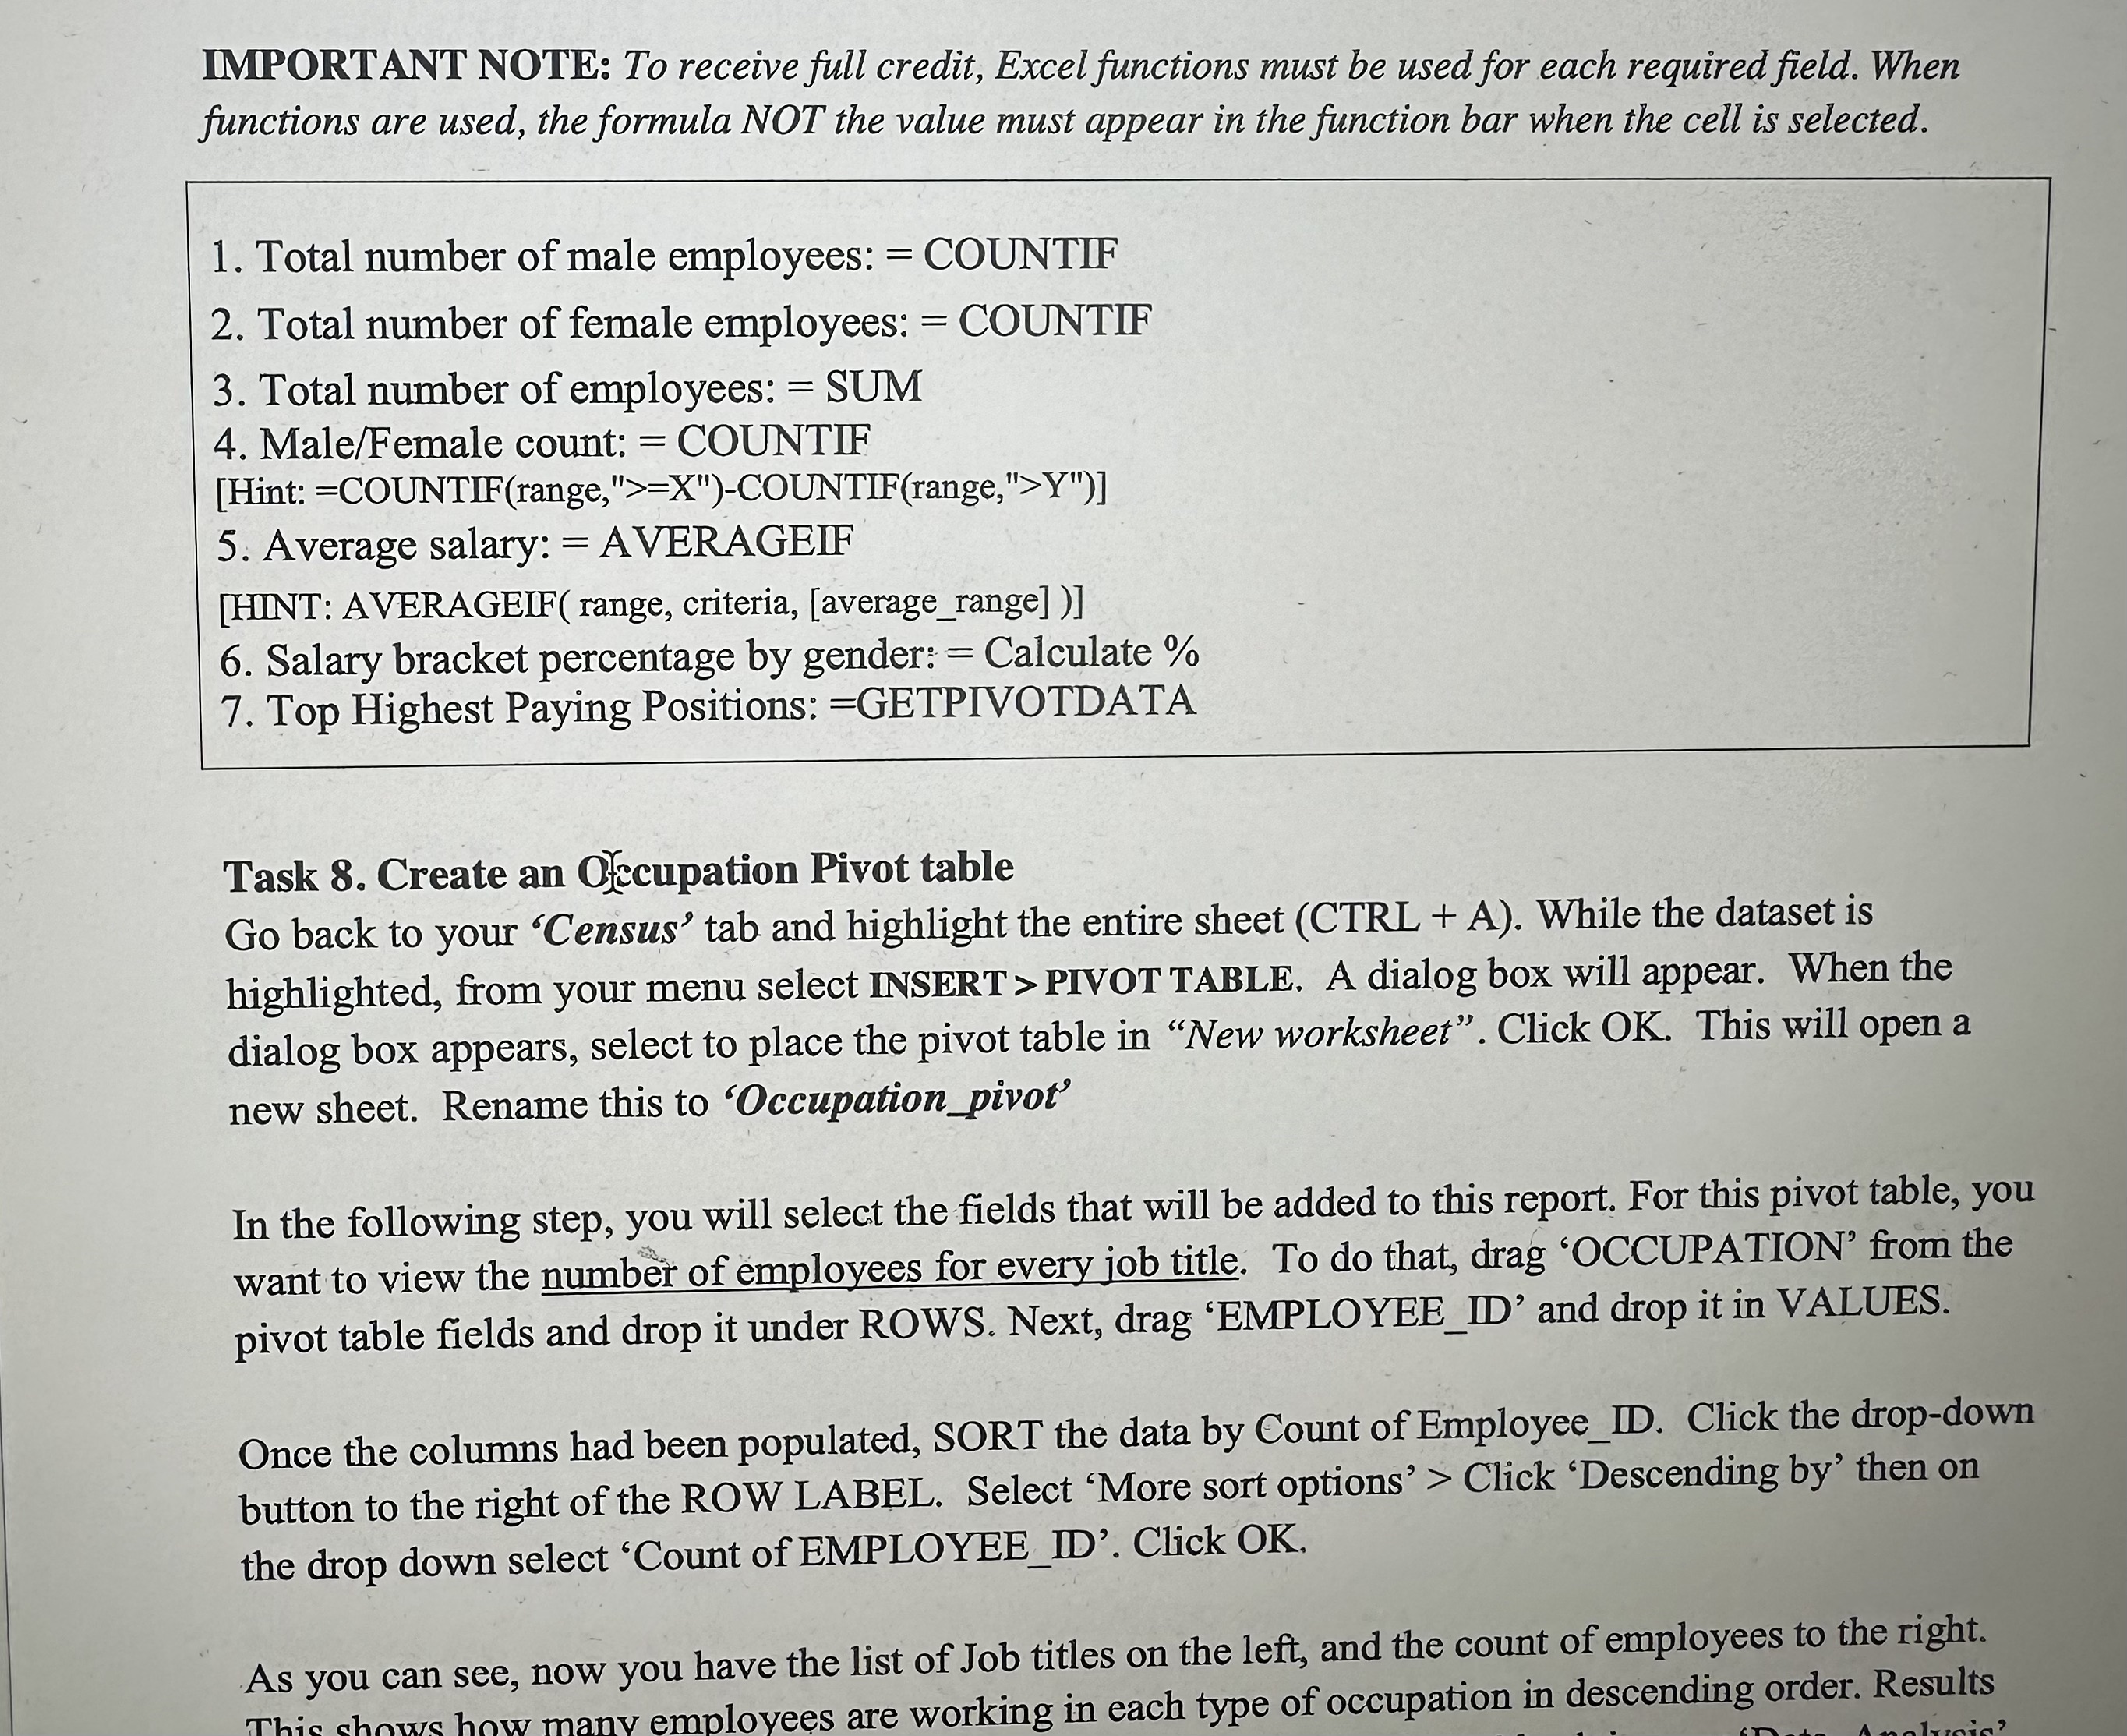
IMPORTANT NOTE: To receive full credit, Excel functions must be used for each required field. When functions are used, the formula NOT the value must appear in the function bar when the cell is selected. 1. Total number of male employees: = COUNTIF 2. Total number of female employees: = COUNTIF 3. Total number of employees: = SUM 4. Male/Female count: = COUNTIF [Hint: = COUNTIF(range,,>=X" )-COUNTIF(range, ">Y")] 5. Average salary: = AVERAGEIF [HINT: AVERAGEIF( range, criteria, [average_range])] 6. Salary bracket percentage by gender: = Calculate % 7. Top Highest Paying Positions: =GETPIVOTDATA Task 8. Create an O\}ecupation Pivot table Go back to your 'Census' tab and highlight the entire sheet (CTRL +A). While the dataset is highlighted, from your menu select INSERT > PIVOT TABLE. A dialog box will appear. When the dialog box appears, select to place the pivot table in "New worksheet". Click OK. This will open a new sheet. Rename this to 'Occupation_pivot' In the following step, you will select the fields that will be added to this report. For this pivot table, you want to view the number of employees for every job title. To do that, drag 'OCCUPATION' from the pivot table fields and drop it under ROWS. Next, drag 'EMPLOYEE_ID' and drop it in VALUES. Once the columns had been populated, SORT the data by Count of Employee_ID. Click the drop-down button to the right of the ROW LABEL. Select 'More sort options' > Click 'Descending by' then on the drop down select 'Count of EMPLOYEE_ID'. Click OK. As you can see, now you have the list of Job titles on the left, and the count of employees to the right. Thic showe how manv employees are working in each type of occupation in descending order. Results IMPORTANT NOTE: To receive full credit, Excel functions must be used for each required field. When functions are used, the formula NOT the value must appear in the function bar when the cell is selected. 1. Total number of male employees: = COUNTIF 2. Total number of female employees: = COUNTIF 3. Total number of employees: = SUM 4. Male/Female count: = COUNTIF [Hint: = COUNTIF(range,,>=X" )-COUNTIF(range, ">Y")] 5. Average salary: = AVERAGEIF [HINT: AVERAGEIF( range, criteria, [average_range])] 6. Salary bracket percentage by gender: = Calculate % 7. Top Highest Paying Positions: =GETPIVOTDATA Task 8. Create an O\}ecupation Pivot table Go back to your 'Census' tab and highlight the entire sheet (CTRL +A). While the dataset is highlighted, from your menu select INSERT > PIVOT TABLE. A dialog box will appear. When the dialog box appears, select to place the pivot table in "New worksheet". Click OK. This will open a new sheet. Rename this to 'Occupation_pivot' In the following step, you will select the fields that will be added to this report. For this pivot table, you want to view the number of employees for every job title. To do that, drag 'OCCUPATION' from the pivot table fields and drop it under ROWS. Next, drag 'EMPLOYEE_ID' and drop it in VALUES. Once the columns had been populated, SORT the data by Count of Employee_ID. Click the drop-down button to the right of the ROW LABEL. Select 'More sort options' > Click 'Descending by' then on the drop down select 'Count of EMPLOYEE_ID'. Click OK. As you can see, now you have the list of Job titles on the left, and the count of employees to the right. Thic showe how manv employees are working in each type of occupation in descending order. Results
Step by Step Solution
There are 3 Steps involved in it

Get step-by-step solutions from verified subject matter experts