

Question: Hello, I am not sure why my graph is not coming out like my instructor's. I know our data is different, but mines is way
Hello, I am not sure why my graph is not coming out like my instructor's. I know our data is different, but mines is way off as far as my graph. I am also unsure on the What if question it is requesting in #6. Can someone help me please?
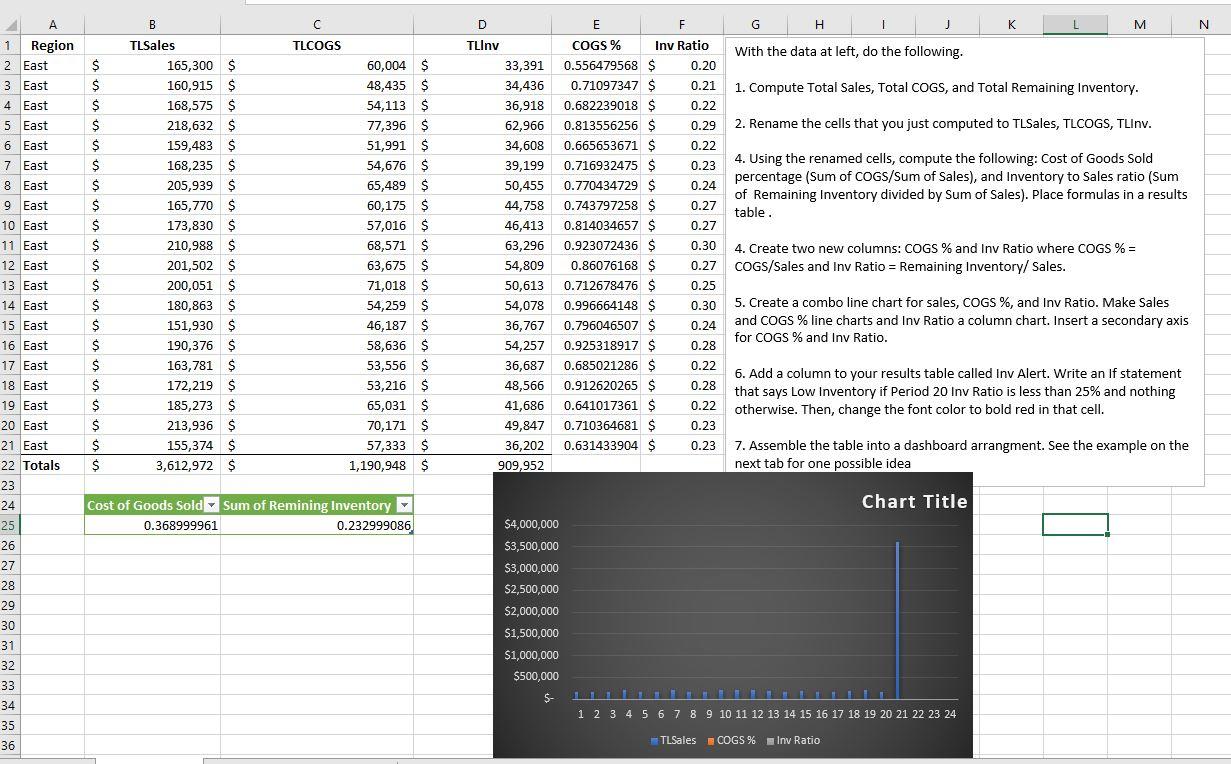
This is my data and graph
This is my instructor's graph and data
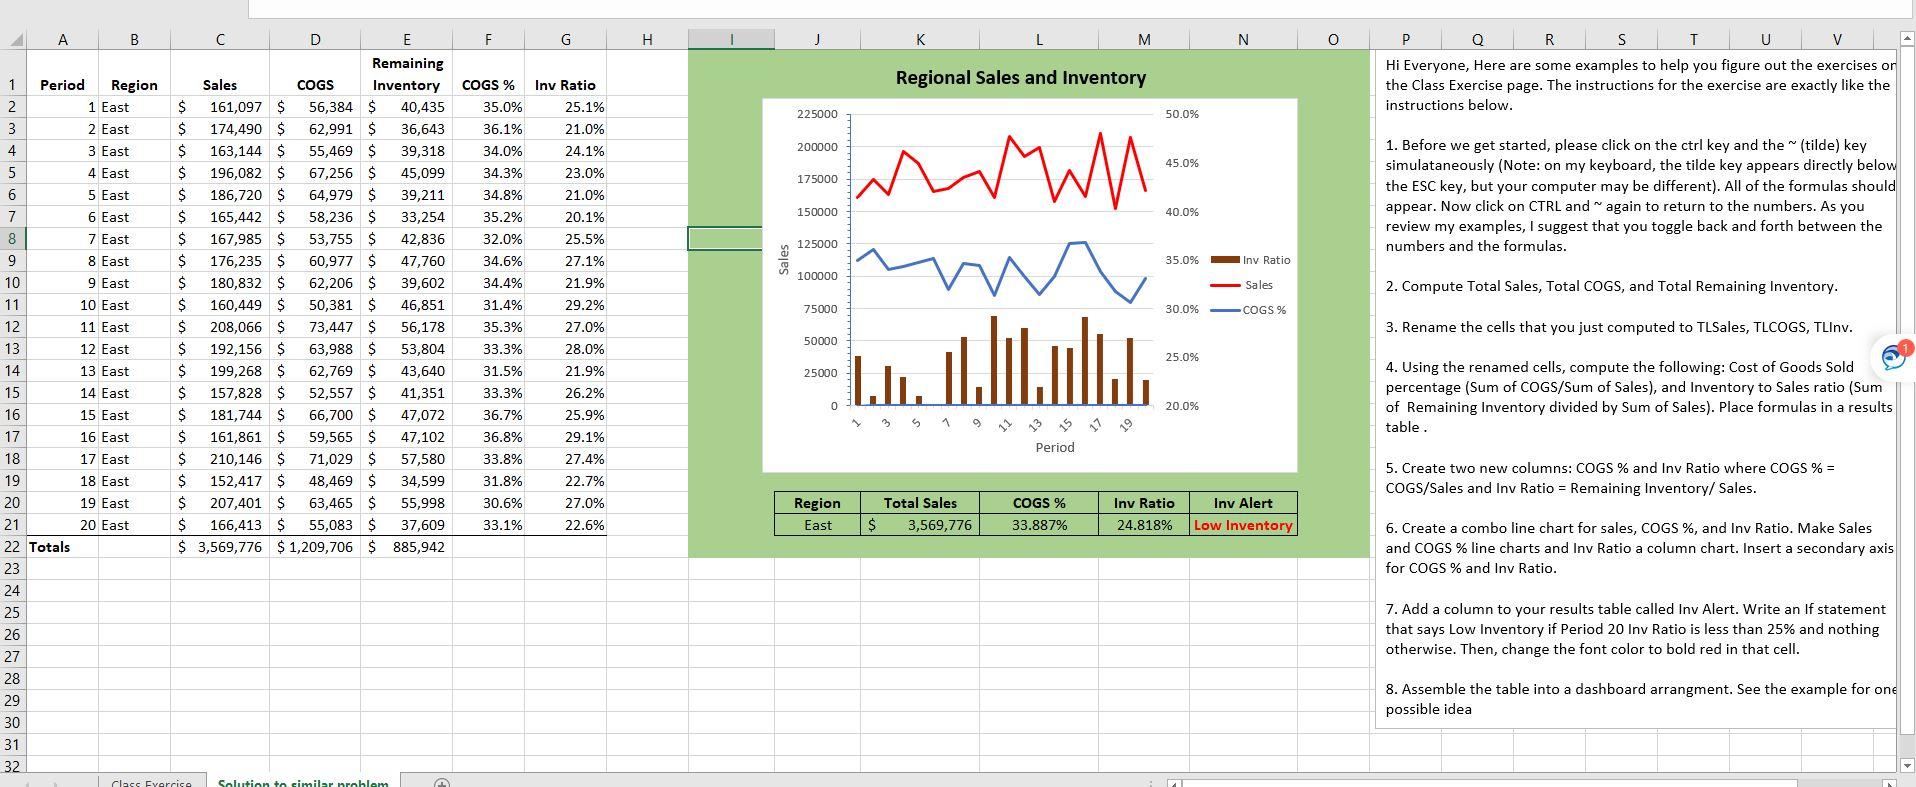
B C D N TLInv A 1 Region 2 East 3 East 4 East 5 East 6 East 7 East 8 East 9 East 10 East 11 East TLSales 165,300 $ 160,915 $ 168,575 $ 218,632 $ 159,483 $ 168,235 $ 205,939 $ 165,770 $ 173,830 $ 210,988 $ 201,502 $ 200,051 $ 180,863 $ 151,930 $ 190,376 $ 163,781 $ 172,219 $ 185,273 $ 213,936 $ 155,374 $ 3,612,972 $ $ $ $ $ $ $ $ $ $ $ $ $ $ $ $ $ $ $ $ $ $ TLCOGS 60,004 $ 48,435 $ 54,113 $ 77,396 $ 51,991 $ 54,676 $ 65,489 $ 60,175 $ 57,016 $ 68,571 $ 63,675 $ 71,018 $ 54,259 $ 46,187 $ 58,636 $ 53,556 $ 53,216 $ 65,031 $ 70,171 $ 57,333 $ 1,190,948 $ 33,391 34,436 36,918 62,966 34,608 39,199 50,455 44,758 46,413 63,296 54,809 50,613 54,078 36,767 54,257 36,687 48,566 41,686 E F G H I J K L M COGS % Inv Ratio With the data at left, do the following. 0.556479568 $ 0.20 0.71097347 $ 0.21 1. Compute Total Sales, Total COGS, and Total Remaining Inventory. 0.682239018 $ 0.22 0.813556256 $ 0.29 2. Rename the cells that you just computed to TLSales, TLCOGS, TLInv. 0.665653671 $ 0.22 4. Using the renamed cells, compute the following: Cost of Goods Sold 0.23 0.716932475 $ percentage (Sum of COGS/Sum of Sales), and Inventory to Sales ratio (Sum 0.770434729 $ 0.24 of Remaining Inventory divided by Sum of Sales). Place formulas in a results 0.743797258 $ 0.27 table. 0.814034657 $ 0.27 0.923072436 $ 0.30 4. Create two new columns: COGS % and Inv Ratio where COGS % = 0.86076168 $ 0.27 COGS/Sales and Inv Ratio = Remaining Inventory/ Sales. 0.712678476 $ 0.25 0.996664148 $ 0.30 5. Create a combo line chart for sales, COGS %, and Inv Ratio. Make Sales 0.796046507 $ 0.24 and COGS % line charts and Inv Ratio a column chart. Insert a secondary axis 0.925318917 $ for COGS % and Inv Ratio. 0.28 0.685021286 $ 0.22 6. Add a column to your results table called Inv Alert. Write an if statement 0.912620265 $ 0.28 that says Low Inventory if Period 20 Inv Ratio is less than 25% and nothing 0.641017361 S 0.22 otherwise. Then, change the font color to bold red in that cell. 0.710364681 $ 0.23 0.631433904 $ 0.23 7. Assemble the table into a dashboard arrangment. See the example on the next tab for one possible idea 12 East 13 East 14 East 15 East 16 East 17 East 49,847 36,202 909,952 Chart Title Cost of Goods Sold Sum of Remining Inventory 0.368999961 0.232999086 18 East 19 East 20 East 21. East 22 Totals 23 24 25 26 27 28 29 30 31 32 33 34 35 $4,000,000 $3,500,000 $3,000,000 $2,500,000 $2,000,000 $1,500,000 $1,000,000 $500,000 $- UNIT 1 2 3 4 5 6 7 8 9 10 11 12 13 14 15 16 17 18 19 20 21 22 23 24 36 TLSales ECOGS % Inv Ratio B F G H 1 K M N 0 Regional Sales and Inventory P Q R S T U V Hi Everyone, Here are some examples to help you figure out the exercises or the Class Exercise page. The instructions for the exercise are exactly like the instructions below. 225000 50.0% 200000 45.0% 175000 1. Before we get started, please click on the ctrl key and the tilde) key simulataneously (Note: on my keyboard, the tilde key appears directly below the ESC key, but your computer may be different). All of the formulas should appear. Now click on CTRL and again to return to the numbers. As you review my examples, I suggest that you toggle back and forth between the numbers and the formulas. 150000 40.0% 125000 35.0% Inv Ratio 100000 Sales C D Remaining Sales COGS Inventory $ 161,097 $ 56,384 $ 40,435 $ 174,490 $ 62,991 $ 36,643 $ 163,144 $ 55,469 $ 39,318 $ 196,082 $ 67,256 $ 45,099 $ 186,720 $ 64,979 $ 39,211 $ 165,442 $ 58,236 $ 33,254 S 167,985 $ 53,755 $ 42,836 $ 176,235 $ 60,977 $ 47,760 $ 180,832 $ 62,206 $ 39,602 $ 160,449 $ 50,381 $ 46,851 $ 208,066 $ 73,447 $ 56,178 $ 192,156 $ 63,988 $ 53,804 $ 199,268 $ 62,769 $ 43,640 $ 157,828 $ 52,557 $ 41,351 S 181,744 $ 66,700 $ 47,072 $ 161,861 $ 59,565 $ 47,102 $ 210,146 $ 71,029 $ 57,580 $ 152,417 $ 48,469 $ 34,599 $ 207,401 $ 63,465 $ 55,998 $ 166,413 $ 55,083 $ 37,609 $ 3,569,776 $ 1,209,706 $ 885,942 www w ul.lil.oli. 2. Compute Total Sales, Total COGS, and Total Remaining Inventory. COGS % 35.0% 36.1% 34.0% 34.3% 34.8% 35.2% 32.0% 34.6% 34.4% 31.4% 35.3% 33.3% 31.5% 33.3% 36.7% 36.8% 33.8% 31.8% 30.6% 33.1% Inv Ratio 25.1% 21.0% 24.1% 23.0% 21.0% 20.1% 25.5% 27.1% 21.9% 29.2% 27.0% 28.0% 21.9% 26.2% 25.9% 29.1% 27.4% 22.7% 27.0% 22.6% 75000 1 Period Region 2 1 East 3 2 East 4 3 East 5 4 East 6 5 East 7 6 East 8 7 East 9 8 East 10 9 East 11 10 East 12 11 East 13 12 East 14 13 East 15 14 East 16 15 East 17 16 East 18 17 East 19 18 East 20 19 East 21 20 East 22 Totals 23 24 25 26 30.0% COGS % 3. Rename the cells that you just computed to TLSales, TLCOGS, TLInv. 50000 25.0% 25000 L.lu. 4. Using the renamed cells, compute the following: Cost of Goods Sold percentage (Sum of COGS/Sum of Sales), and Inventory to Sales ratio (Sum of Remaining Inventory divided by Sum of Sales). Place formulas in a results 0 20.0% table. Period 5. Create two new columns: COGS % and Inv Ratio where COGS % = COGS/Sales and Inv Ratio = Remaining Inventory/ Sales. Region East Total Sales $ 3,569,776 COGS % 33.887% Inv Ratio 24.818% Inv Alert Low Inventory 6. Create a combo line chart for sales, COGS %, and Inv Ratio. Make Sales and COGS % line charts and Inv Ratio a column chart. Insert a secondary axis for COGS % and Inv Ratio. 7. Add a column to your results table called Inv Alert. Write an If statement that says Low Inventory if Period 20 Inv Ratio is less than 25% and nothing otherwise. Then, change the font color to bold red in that cell. 27 28 29 30 8. Assemble the table into a dashboard arrangment. See the example for one possible idea 31 32 Class Fyercise Solution to similar
Step by Step Solution
There are 3 Steps involved in it
1 Expert Approved Answer
Step: 1 Unlock

Question Has Been Solved by an Expert!
Get step-by-step solutions from verified subject matter experts
Step: 2 Unlock
Step: 3 Unlock