

Question: Hello, I am trying to understand this example. Can you please help? I do not understand where they are getting 0.21 comes out to -0.81
Hello, I am trying to understand this example. Can you please help? I do not understand where they are getting 0.21 comes out to -0.81
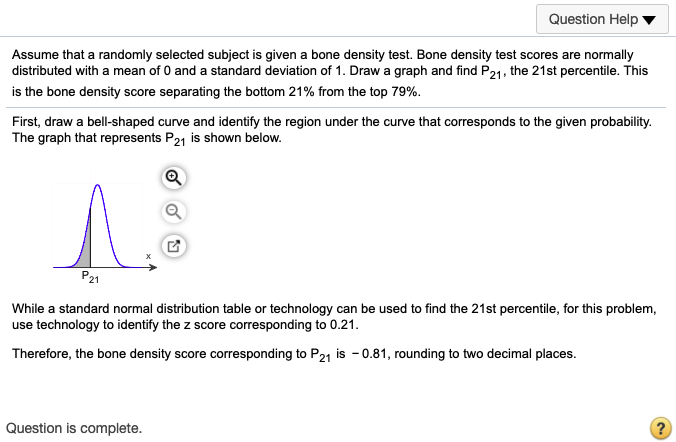
Question Help Assume that a randomly selected subject is given a bone density test. Bone density test scores are normally distributed with a mean of 0 and a standard deviation of 1. Draw a graph and find P21, the 21st percentile. This is the bone density score separating the bottom 21% from the top 79%. First, draw a bell-shaped curve and identify the region under the curve that corresponds to the given probability. The graph that represents Paq is shown below. X P 21 While a standard normal distribution table or technology can be used to find the 21st percentile, for this problem, use technology to identify the z score corresponding to 0.21. Therefore, the bone density score corresponding to Pay is - 0.81, rounding to two decimal places. Question is complete
Step by Step Solution
There are 3 Steps involved in it

Get step-by-step solutions from verified subject matter experts