

Question: Hello, I am working on a project concerning the Central Limit Theorem and I would like some help figuring something out. We are asked to
Hello,
I am working on a project concerning the Central Limit Theorem and I would like some help figuring something out.
We are asked to used some math package (could be Mathematica, or Python, FORTRAN, &c.) to investigate the central limit theorem. We are asked to use a random number generator from our chosen package, and "write a program (subroutine) that returns a random variable that takes on values between zero and one, but has a distribution function of your choice". Furthermore, we are asked to consider how 'a non-linear "map" of the [0,1] interval onto a [0,1] interval alters the distribution of an evenly-distributed x, and then ask yourself how to choose the "map" (i.e. a function, either an analytical function or a code) that produces a distribution function that you want to obtain.'
I have decided to try first to use the function 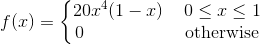 for which I have the expected value
  and a variance of
  . My question is: how do I implement the random number approach correctly to begin this problem? I can easily do a histogram plot and other analyses in Mathematica, Python, etc., but I am not sure how to begin. Specifically:
1. How do I pick the non-linear map that generates this distribution; and
2. Calculate the variance of the "new" distribution. Hint: what is the variance of the original random number generator?
Step by Step Solution
There are 3 Steps involved in it

Get step-by-step solutions from verified subject matter experts