

Question: Hello, I have a case project for my Business Stats class and I would really appreciate if someone helps me with the questions and explaining
Hello, I have a case project for my Business Stats class and I would really appreciate if someone helps me with the questions and explaining each question so I can get a better grasp on the material. Below is the case problem and 4 questions below. Thank you so much in advance! What will your portfolio be worth in 10 years? In 20 years? When you stop working? The Human Resources Department at Four Corners Corporation was asked to develop a financial planning model that would help employees address these questions. Tom Gifford was asked to lead this effort and decided to begin by developing a financial plan for himself. Tom has a degree in business and, at the age of 40, is making $85,000 per year. Through contributions to his company's retirement program and the receipt of a small inheritance, Tom has accumulated a portfolio valued at $50,000. Tom plans to work 20 more years and hopes to accumulate a portfolio valued at $1,000,000. Can he do it? Tom began with a few assumptions about his future salary, his new investment contributions, and his portfolio growth rate. He assumed a 5% annual salary growth rate and plans to make new investment contributions at 6% of his salary. After some research on historical stock market performance, Tom decided that a 10% annual portfolio growth rate was reasonable. Using these assumptions, Tom developed the following Excel worksheet (*which is the excel graph shown in the attachment) The worksheet provides a financial projection for the next five years. In computing the portfolio earnings for a given year, Tom assumed that his new investment contribution would occur evenly throughout the year, and thus half of the new investment could be included in the computation of the portfolio earnings for the year. From the worksheet, we see that, at age 45, Tom is projected to have a portfolio valued at $116,321. Tom's plan was to use this worksheet as a template to develop financial plans for the company's employees. The data in the spreadsheet would be tailored for each employee, and rows would be added to it to reflect the employee's planning horizon. After adding another 15 rows to the worksheet, Tom found that he could expect to have a portfolio of $772,722 after 20 years. Tom then took his results to show his boss, Kate Krystkowiak. ISDS 361B Spring 2018 Although Kate was pleased with Tom's progress, she voiced several criticisms. One of the criticisms was the assumption of a constant annual salary growth rate. She noted that most employees experience some variation in the annual salary growth rate from year to year. In addition, she pointed out that the constant annual portfolio growth rate was unrealistic and that the actual growth rate would vary considerably from year to year. She further suggested that a simulation model for the portfolio projection might allow Tom to account for the random variability in the salary growth rate and the portfolio growth rate. After some research, Tom and Kate decided to assume that the annual salary growth rate would vary from 0 to 5% and that a uniform probability distribution would provide a realistic approximation. Four Corners' accountants suggested that the annual portfolio growth rate could be approximated by a normal probability distribution with a mean of 10% and a standard deviation of 5%. With this information, Tom set off to redesign his spreadsheet so that it could be used by the company's employees for financial planning. Managerial Report Play the role of Tom Gifford, and develop a simulation model for financial planning. Tom's boss needs a report which includes each of the following: THE CASE QUESTIONS: 1. Without considering the random variability in growth rates, extend the worksheet given to 20 years.Confirm that by using the constant annual salary growth rate and the constant annual portfolio growth rate, Tom can expect to have a 20-year portfolio of $772,722. What would Tom's annual investment rate have to increase to in order for his portfolio to reach a 20-year goal of $1,000,000? 2. Incorporate the random variability of the annual salary growth rate and the annual portfolio growth rate into a simulation model. Salary growth is assumed to follow a uniform distribution between 0% and 10%. (Note: the text case says between 0% and 5%.Use a uniform distribution between 0% and 10%.) Portfolio growth is assumed to follow a normal distribution with mean 10% and standard deviation 5%.Assume further an annual investment rate of 9%.Using the following random numbers generate values for salary and portfolio growth and perform a 20-year simulation. ( Note: salary growth is not needed for the first year.) What is the portfolio value after 20 years? Salary Growth: 0.559 0.903 0.310 0.945 0.287 0.233 0.022 0.013 0.195 0.411 0.154 0.138 0.884 0.130 0.175 0.044 0.707 0.720 0.242 Portfolio Growth: 0.330 0.043 0.501 0.885 0.380 0.533 0.115 0.520 0.122 0.144 0.321 0.696 0.516 0.266 0.456 0.053 0.305 0.912 0.131 0.758 3. Generate your own random numbers and perform the 20-year simulation another 9 times.On the basis of your results for all ten simulations, answer the following: What percentage of the time is the $1,000,000 goal met? What is the mean 20-year portfolio value? What is the standard deviation? What is the maximum? What is the minimum? 4. What recommendation do you have for employees with a current profile similar to Tom's after seeing the impact of the uncertainty in the annual salary growth rate and the annual portfolio growth rate?
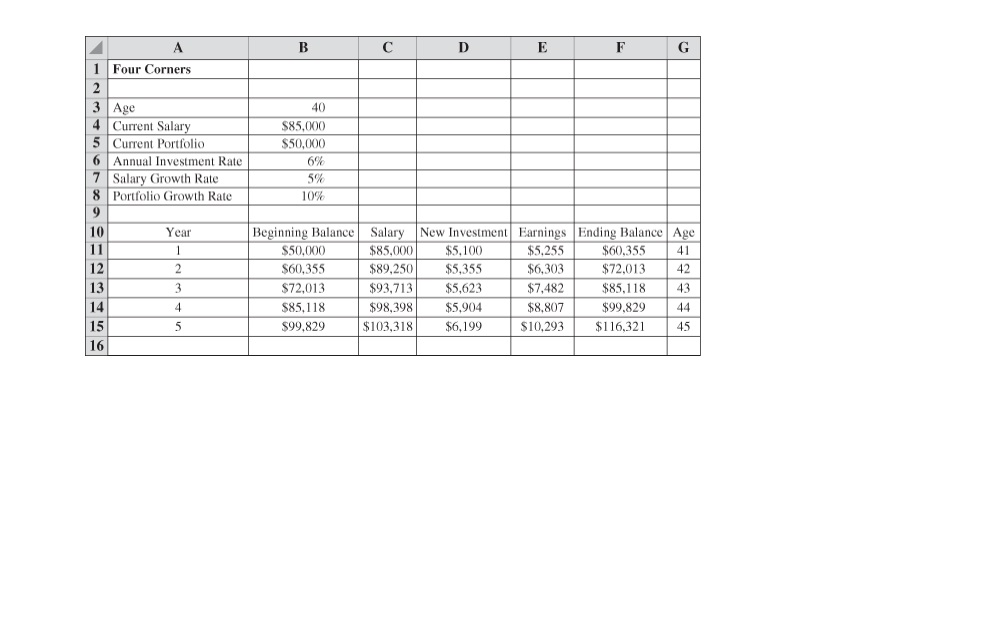
A B C D E F G UI AWN- Four Corners 40 Current Salary $85,000 Current Portfolio $50,000 Annual Investment Rate 6% 7 Salary Growth Rate 5% 8 Portfolio Growth Rate 10% 9 10 Year Beginning Balance Salary 11 New Investment Earnings Ending Balance Age 1 $50,000 $85,000 $5,100 $5.255 $60.355 41 12 2 $60,355 $89,250 $5,355 $6,303 $72.013 42 13 3 $72,013 $93,713 $5,623 $7,482 14 $85,118 43 4 $85,118 $98,398 $5,904 $8,807 $99.829 44 15 $99,829 $103,318 $6,199 $10,293 16 $116.321 45
Step by Step Solution
There are 3 Steps involved in it

Get step-by-step solutions from verified subject matter experts