

Question: Hello there, I have an economics math based question and have provided the question via image, on one part of the question it has a
Hello there, I have an economics math based question and have provided the question via image, on one part of the question it has a graph but I'm having trouble finding where to place the line on the graph. Could you draw the line out and provide an image if possible
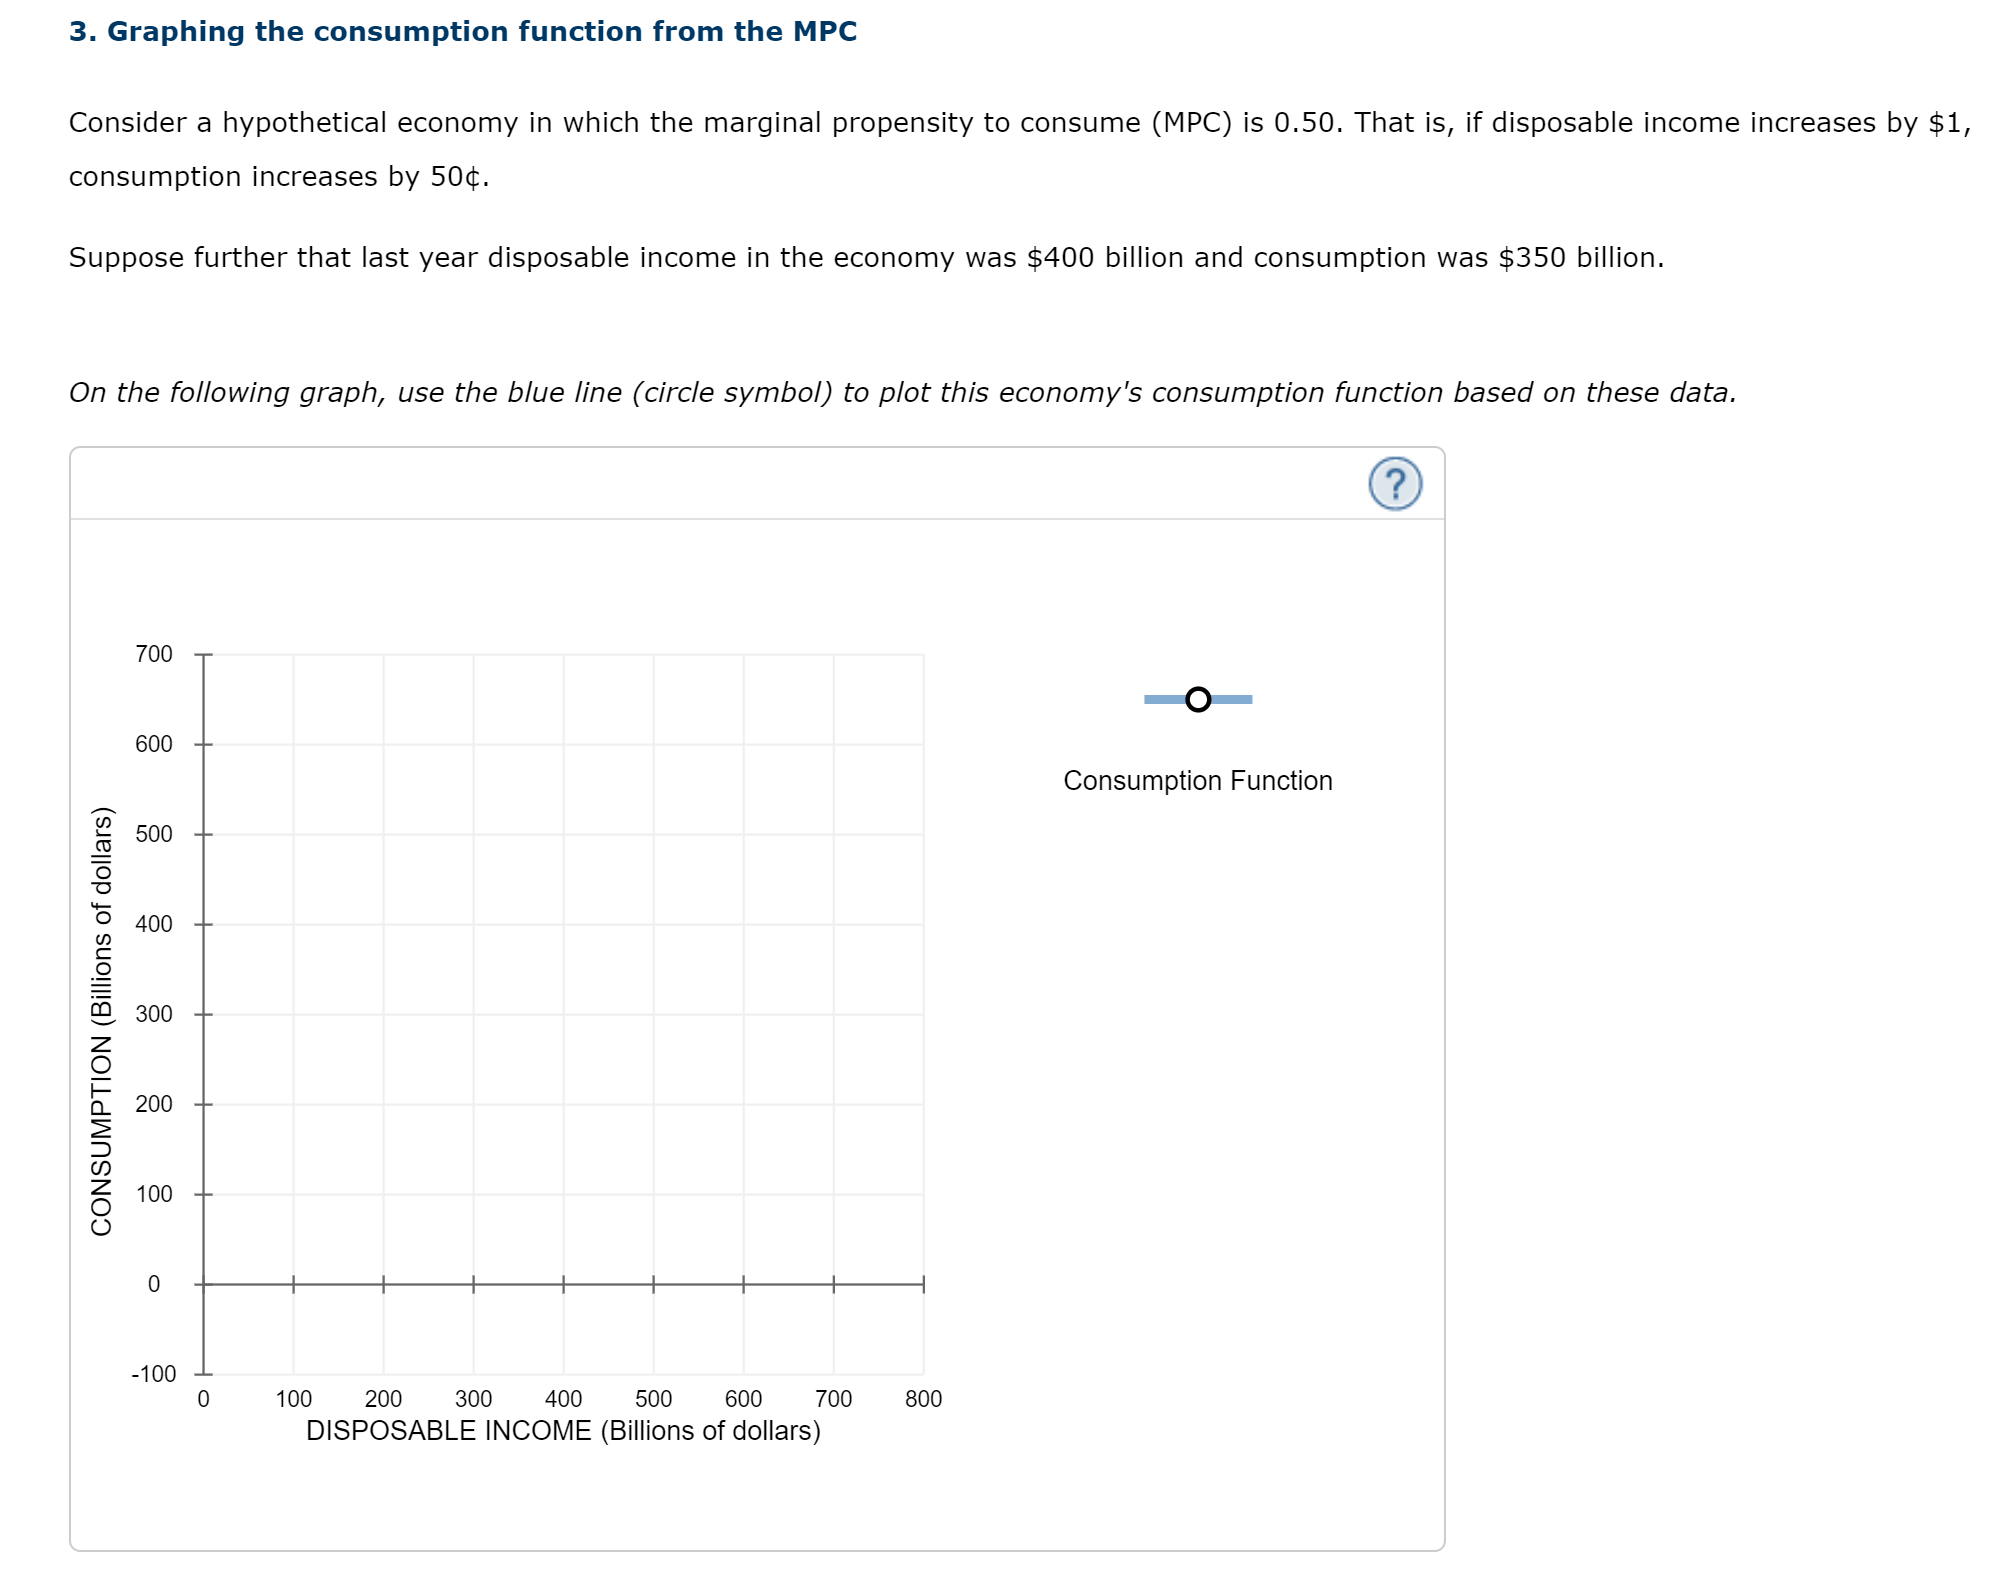
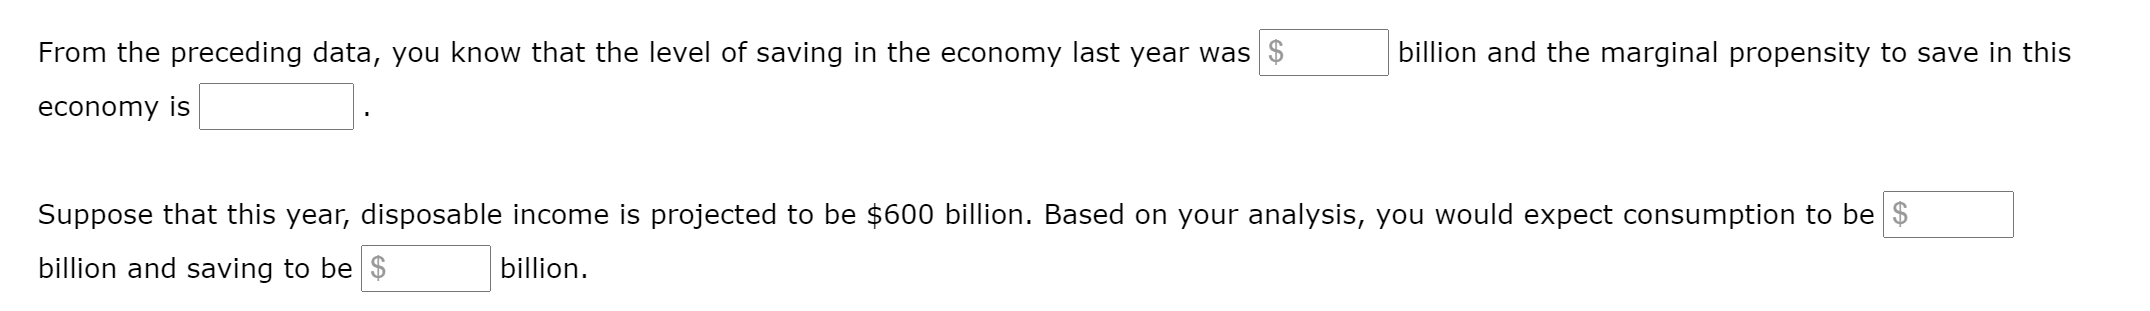
3. Graphing the consumption function from the MPC Consider a hypothetical economy in which the marginal propensity to consume (MPC) is 0.50. That is, if disposable income increases by $1, consumption increases by 50. Suppose further that last year disposable income in the economy was $400 billion and consumption was $350 billion. On the following graph, use the blue line ( circle symbol) to plot this economy's consumption function based on these data. 700 * 600 Consumption Function 500 400 300 200 100 CONSUMPTION (Billions of dollars) -100 O 100 200 300 400 500 600 700 800 DISPOSABLE INCOME (Billions of dollars) From the preceding data, you know that the level of saving in the economy last year was billion and the marginal propensity to save in this Suppose that this year, disposable income is projected to be $600 billion. Based on your analysis, you would expect consumption to be billion and saving to be billion
Step by Step Solution
There are 3 Steps involved in it

Get step-by-step solutions from verified subject matter experts