

Question: Hello, I have just completed the work for a Statistcs hw. There is one small question I am stuck on. Attached are the questions I
Hello, I have just completed the work for a Statistcs hw. There is one small question I am stuck on.
Attached are the questions I answered and the a graph I need help with .
(SEE GRAPH ATTACHMENT) 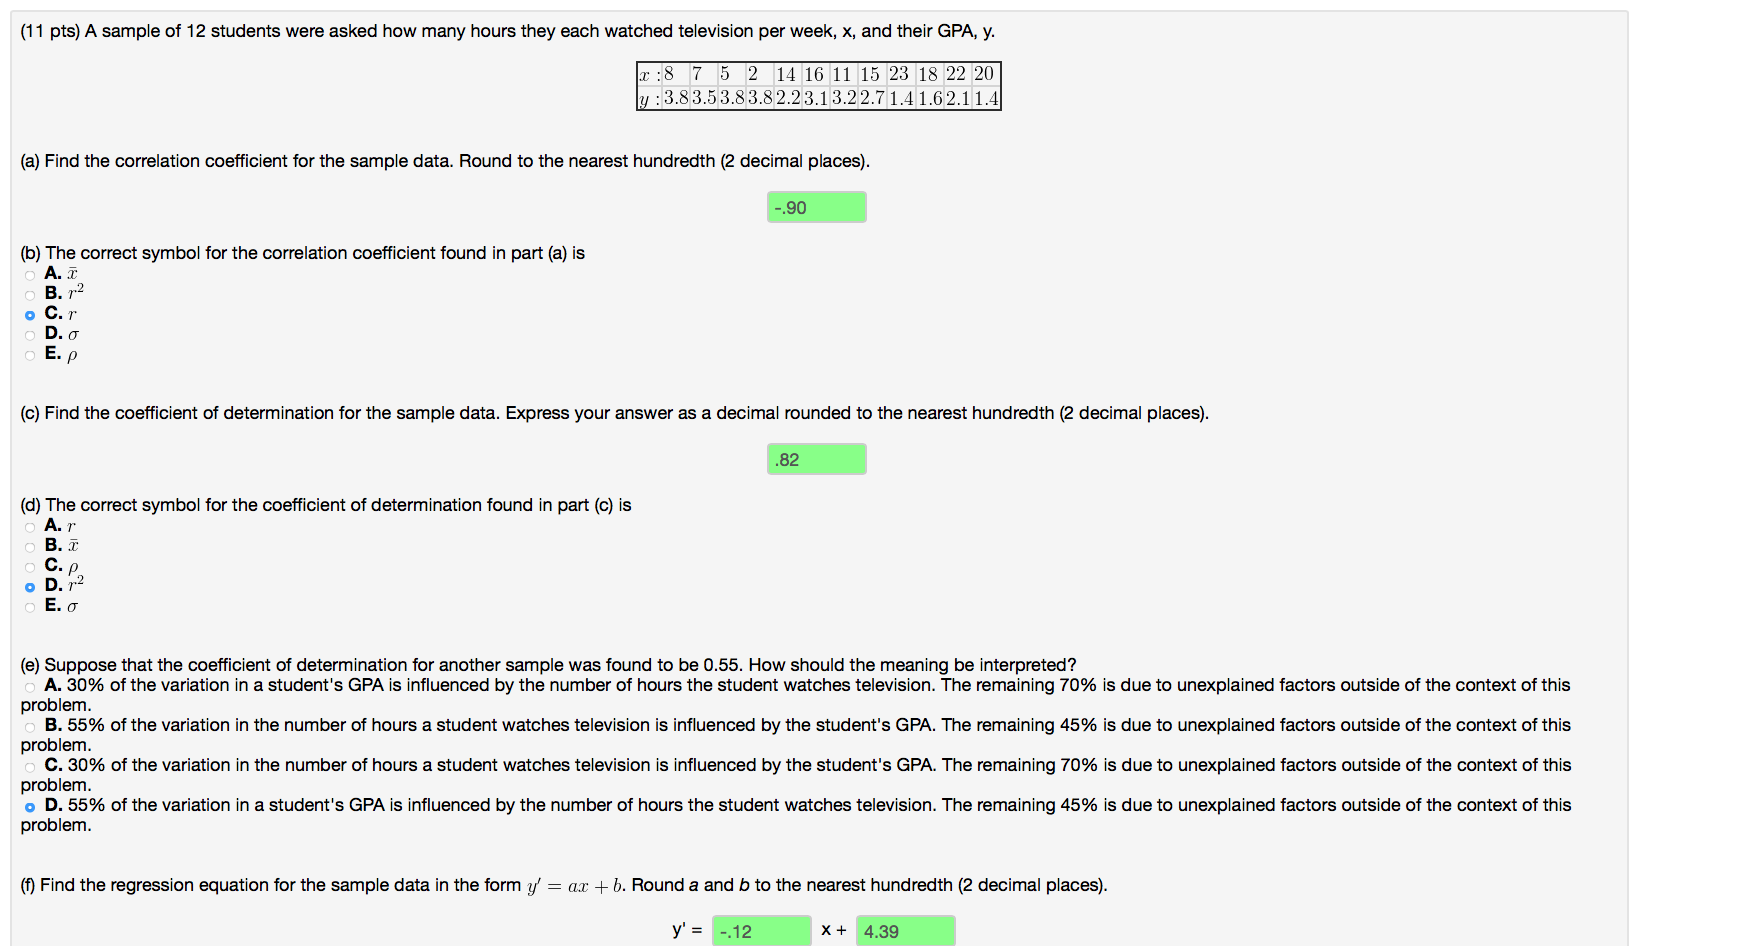
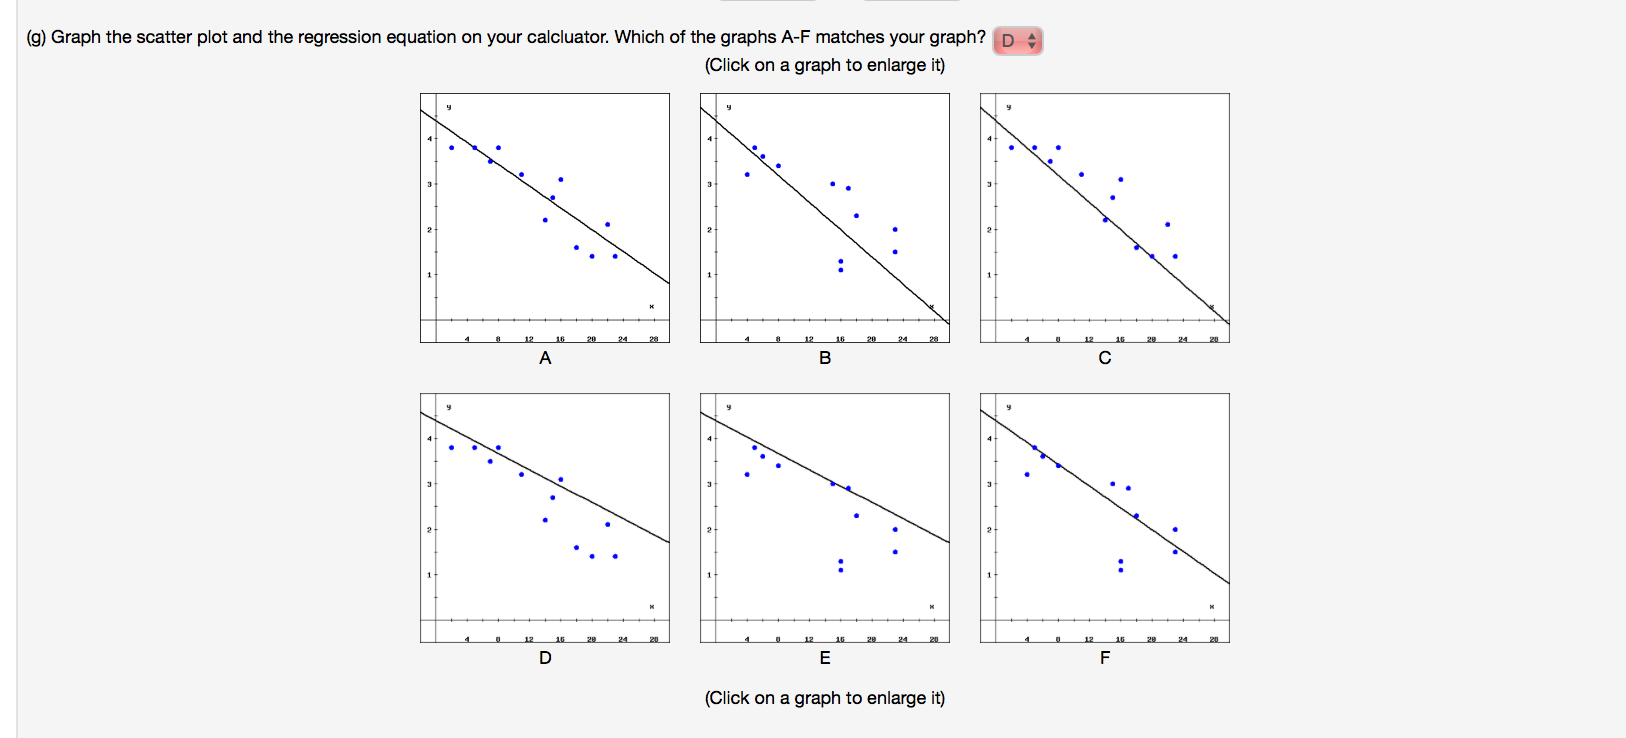
(11 p1s)A sample of 12 students were asked how many hours they each watched television per week. x, and their GPA, y. 161115 2318 22 2|] 3.8 3.5 3.8 3.8 2.2 3.13.2 2.71.41.62.11.4 (a) Find the correlation coefficient for the sample data. Round to the nearest hundredth (2 decimal places). .90 (b) The correct symbol for the correlation coefcient found in part (a) is ._ A. i H B. 7.2 o c. 1\" \" D.U \" E.p (c) Find the coefficient of determination for the sample data. Express your answer as a decimal rounded to the nearest hundredth (2 decimal places). .82 (d) The correct symbol for the coefcient of determination found in part (c) is A. T ppm 'i'ui-il I" o (e) Suppose that the coefficient of determination for another sample was found to be 0.55. How should the meaning be interpreted? H A. 30% of the variation in a student's GPA is influenced by the number of hours the student watches television. The remaining 70% is due to unexplained factors outside of the context of this magi-2% of the variation in the number of hours a student watches television is inuenced by the student's GPA. The remaining 45% is due to unexplained factors outside of the context of this Drag-$96 of the variation in the number of hours a student watches television is influenced by the student's GPA. The remaining 70% is due to unexplained factors outside of the context of this EOEErSrg-S of the variation in a student's GPA is influenced by the number of hours the student watches television. The remaining 45% is due to unexplained factors outside of the context of this pro em. (t) Find the regression equation for the sample data in the form 9' : ax + b. Round a and b to the nearest hundredth (2 decimal places). y'= -.12 X+ 4.39 m) Graph the scatter plot and the regression equation on your calcluator. Which of the graphs AF matches your graph? ! (Click on a graph to enlarge it) (Click on a graph to enlarge it)
Step by Step Solution
There are 3 Steps involved in it

Get step-by-step solutions from verified subject matter experts