

Question: Hello, I have two different types of data. One data is based on observation of Herring Gulls frequency at 3 different parking lots (location labeled
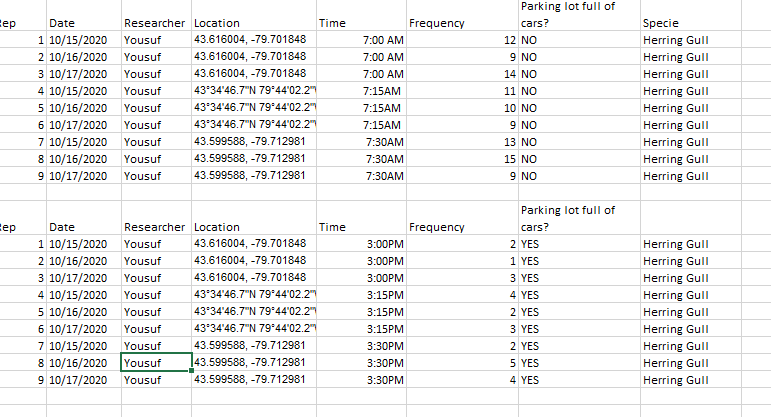
Hello, I have two different types of data. One data is based on observation of Herring Gulls frequency at 3 different parking lots (location labeled in (coordinates), recorded on three separate days at a time around 7 am, where the parking lots don't contain any motor vehicle occupied. I was wondering, If I should take the mean of the number of Herring Gulls observed on three different days of the same location and compute one value. Reason I did three days, is to have more then 2 replicates for each observation noted.
The other DATA that I have is the same type of setup as DATA number one except for different times and number of motor vehicle occupying the parking space. When you look at the following data, you will notice that when parking spaces are occupied, number of Herring Gulls is very low, meanwhile, when parking spaces are not occupied, # of Herring Gulls is very high. Below I attached a photo of both two data. I was wondering what type of statistical test should be on this type of DATA and how do I do it?
\f
Step by Step Solution
There are 3 Steps involved in it

Get step-by-step solutions from verified subject matter experts