

Question: Hello, I hope your day is going well so far! I am really struggling with my assignment for Intro to Statistics, and I was hoping
Hello, I hope your day is going well so far!
I am really struggling with my assignment for Intro to Statistics, and I was hoping I would be able to receive some help. I will attach the pictures of the assignment below. I would really appreciate if all the work could be shown!
Thank you so much! I will learn greatly after receiving help.
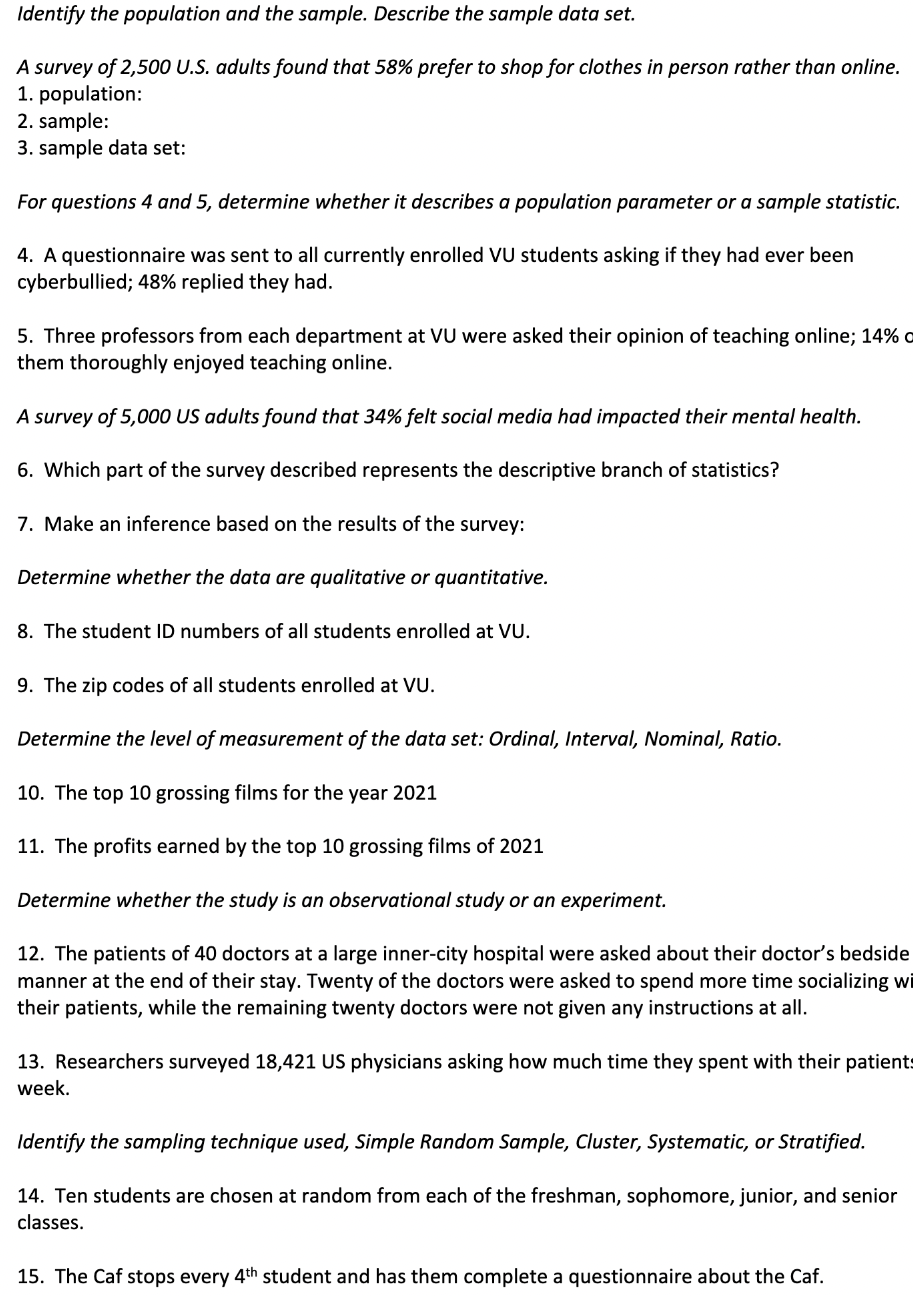
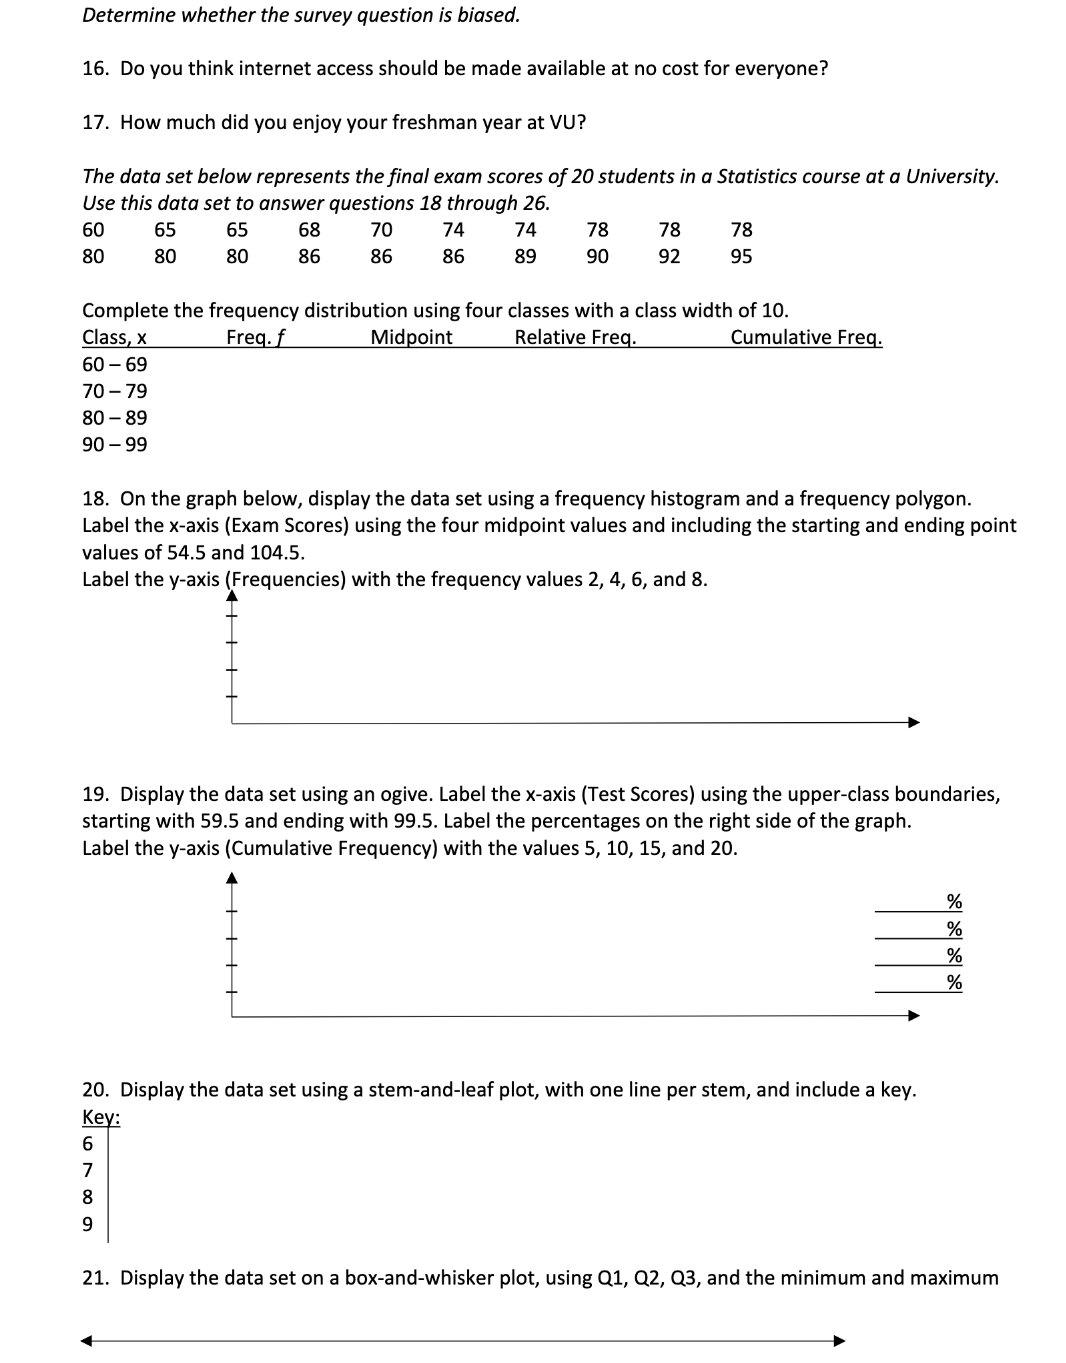
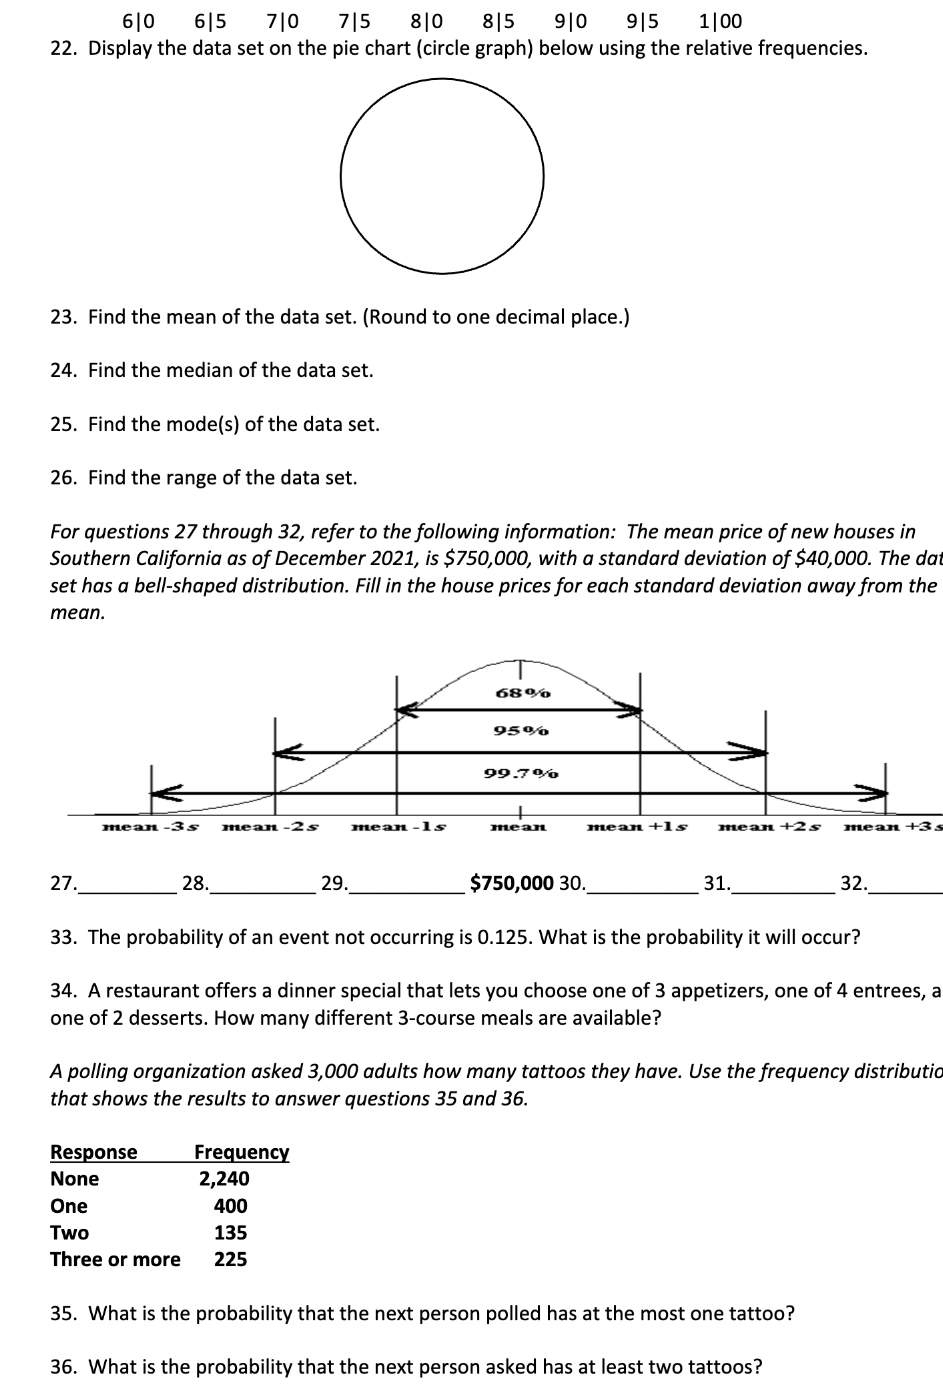
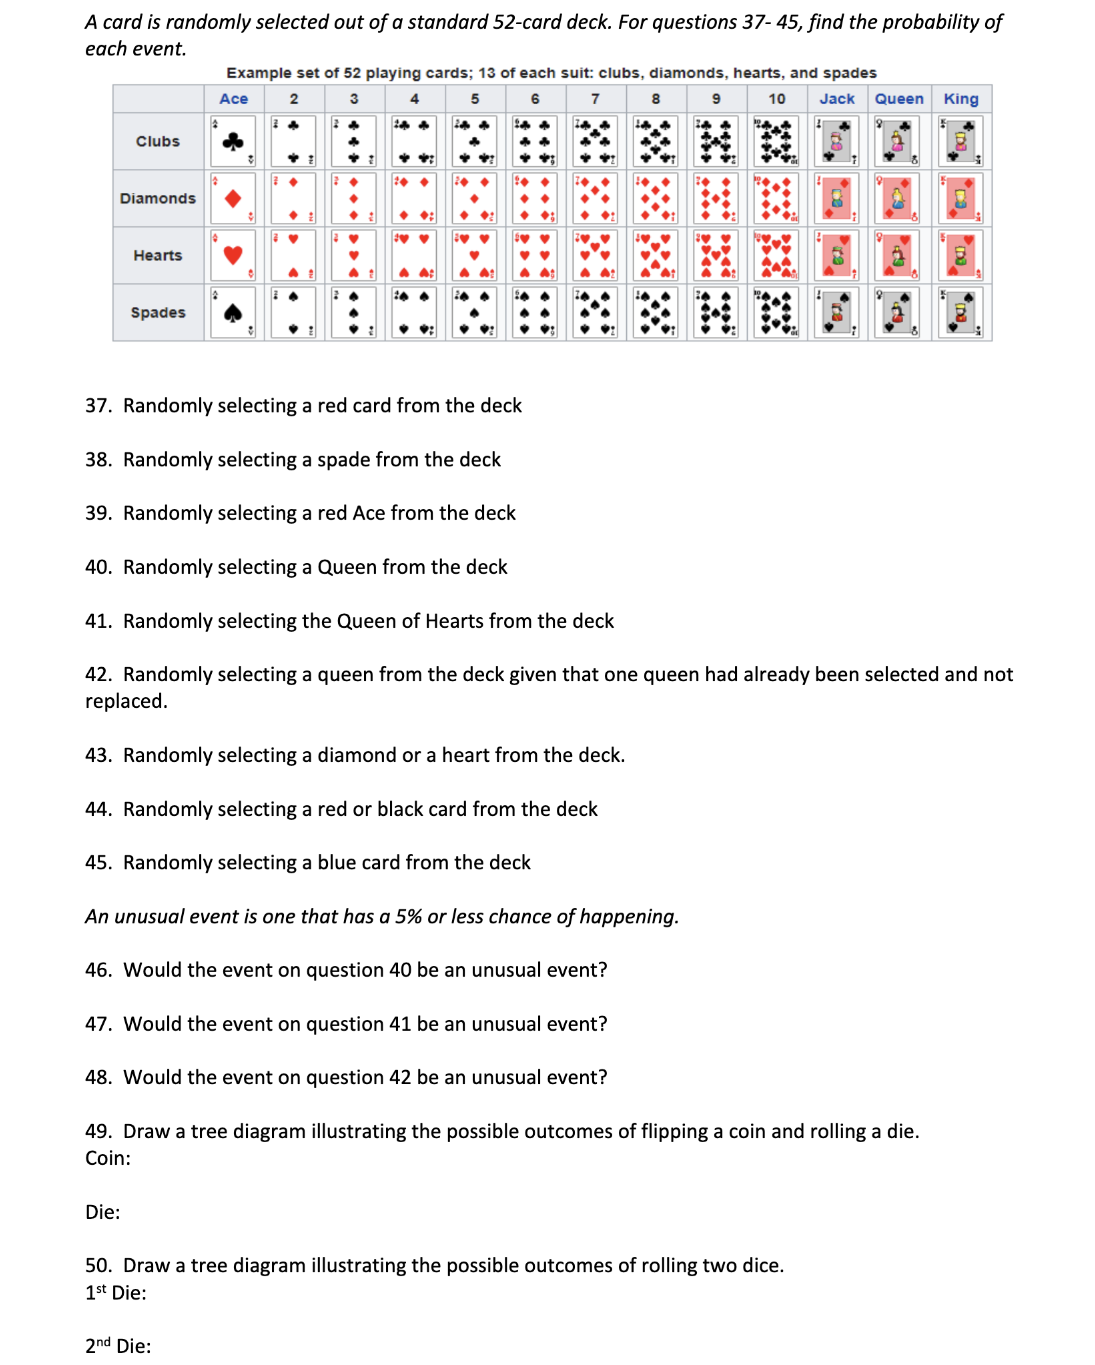
Identify the population and the sample, Describe the sample data set. A survey of 2,500 U.S. adults found that 58% prefer to shop for clothes in person rather than online. 1. population: 2. sample: 3. sample data set: For questions 4 and 5, determine whether it describes a population parameter or a sample statistic. 4. A questionnaire was sent to all currently enrolled VU students asking if they had ever been cyberbullied; 48% replied they had. 5. Three professors from each department at VU were asked their opinion of teaching online; 14% them thoroughly enjoyed teaching online. A survey of 5,000 US adults found that 34% felt social media had impacted their mental health. 6. Which part of the survey described represents the descriptive branch of statistics? 7. Make an inference based on the results of the survey: Determine whether the data are qualitative or quantitative. 8. The student ID numbers of all students enrolled at VU. 9. The zip codes of all students enrolled at VU. Determine the level of measurement of the data set: Ordinal, Interval, Nominal, Ratio. 10. The top 10 grossing films for the year 2021 11. The profits earned by the top 10 grossing films of 2021 Determine whether the study is an observational study or an experiment. 12. The patients of 40 doctors at a large inner-city hospital were asked about their doctor's bedside manner at the end of their stay. Twenty of the doctors were asked to spend more time socializing wi their patients, while the remaining twenty doctors were not given any instructions at all. 13. Researchers surveyed 18,421 US physicians asking how much time they spent with their patient: week. ldentify the sampling technique used, Simple Random Sample, Cluster, Systematic, or Stratified. 14. Ten students are chosen at random from each of the freshman, sophomore, junior, and senior classes. 15. The Caf stops every 4t" student and has them complete a questionnaire about the Caf. Determine whether the survey question is biased. 16. Do you think internet access should be made available at no cost for everyone? 17. How much did you enjoy your freshman year at VU? The data set below represents the final exam scores of 20 students in a Statistics course at a University. Use this data set to answer questions 18 through 26. 60 65 65 68 70 74 74 78 78 78 80 80 80 86 86 86 89 90 92 95 Complete the frequency distribution using four classes with a class width of 10. Class, x Freq. f Midpoint Relative Freq. Cumulative Freq. 60 -69 70-79 80-89 90-99 18. On the graph below, display the data set using a frequency histogram and a frequency polygon. Label the x-axis (Exam Scores) using the four midpoint values and including the starting and ending point values of 54.5 and 104.5. Label the y-axis (Frequencies) with the frequency values 2, 4, 6, and 8. > 19. Display the data set using an ogive. Label the x-axis (Test Scores) using the upper-class boundaries, starting with 59.5 and ending with 99.5. Label the percentages on the right side of the graph. Label the y-axis (Cumulative Frequency) with the values 5, 10, 15, and 20. R RRRR 20. Display the data set using a stem-and-leaf plot, with one line per stem, and include a key. Key: W 0o~ 21. Display the data set on a box-and-whisker plot, using Q1, Q2, Q3, and the minimum and maximum 60 6|5 7/0 7|5 80 85 90 9|5 1|00 22. Display the data set on the pie chart (circle graph) below using the relative frequencies. 23. Find the mean of the data set. (Round to one decimal place.) 24. Find the median of the data set. 25. Find the mode(s) of the data set. 26. Find the range of the data set. For questions 27 through 32, refer to the following information: The mean price of new houses in Southern California as of December 2021, is $750,000, with a standard deviation of $40,000. The dat set has a bell-shaped distribution. Fill in the house prices for each standard deviation away from the mean. 27. 28, 29. $750,000 30. 31. 32. 33. The probability of an event not occurring is 0.125. What is the probability it will occur? 34. Arestaurant offers a dinner special that lets you choose one of 3 appetizers, one of 4 entrees, a one of 2 desserts. How many different 3-course meals are available? A polling organization asked 3,000 adults how many tattoos they have. Use the frequency distributio that shows the results to answer questions 35 and 36. Response Frequency None 2,240 One 400 Two 135 Three or more 225 35. What is the probability that the next person polled has at the most one tattoo? 36. What is the probability that the next person asked has at least two tattoos? A card is randomly selected out of a standard 52-card deck. For questions 37- 45, find the probability of each event. Example set of 52 playing cards; 13 of each suit: clubs, diamonds, hearts, and spades Ace 2 3 5 6 8 9 10 Jack Queen King Clubs Diamonds Hearts Spades 37. Randomly selecting a red card from the deck 38. Randomly selecting a spade from the deck 39. Randomly selecting a red Ace from the deck 40. Randomly selecting a Queen from the deck 41. Randomly selecting the Queen of Hearts from the deck 42. Randomly selecting a queen from the deck given that one queen had already been selected and not replaced. 43. Randomly selecting a diamond or a heart from the deck. 44. Randomly selecting a red or black card from the deck 45. Randomly selecting a blue card from the deck An unusual event is one that has a 5% or less chance of happening. 46. Would the event on question 40 be an unusual event? 47. Would the event on question 41 be an unusual event? 48. Would the event on question 42 be an unusual event? 49. Draw a tree diagram illustrating the possible outcomes of flipping a coin and rolling a die. Coin: Die: 50. Draw a tree diagram illustrating the possible outcomes of rolling two dice. 1 st Die: 2nd Die
Step by Step Solution
There are 3 Steps involved in it

Get step-by-step solutions from verified subject matter experts