

Question: Hello, I just need help understanding how these solutions in the chart were done through excel for clarification. Below I posted the question along with
Hello, I just need help understanding how these solutions in the chart were done through excel for clarification. Below I posted the question along with the excel chart answers for guidance. Would someone be able to replicate the exact same chart but demonstrate the excel formulas for each cell to show how each cell came to an answer? I will leave a thumbs up!
ANSWERS IN EXCEL CHART:
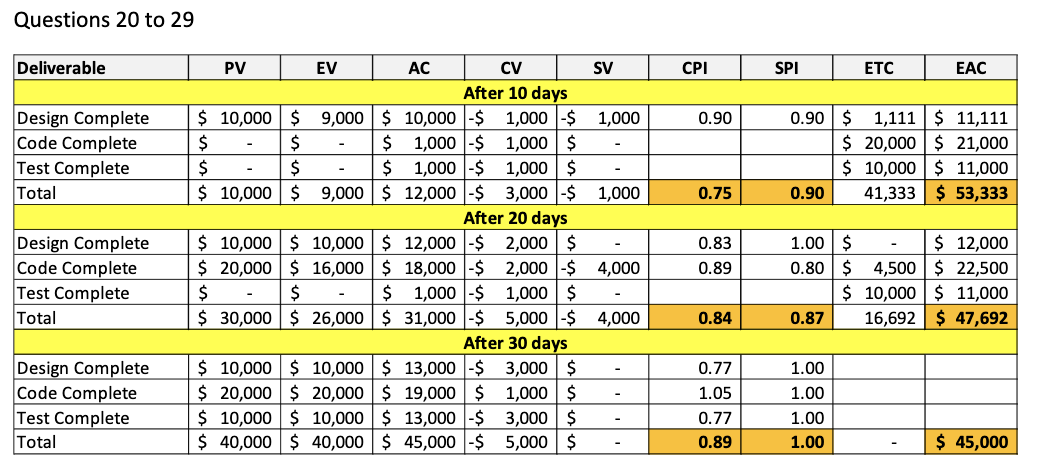 Just need a replica image of this but with the formulas for each cell, please and thank you!
Step by Step Solution
There are 3 Steps involved in it
1 Expert Approved Answer
Step: 1 Unlock

Question Has Been Solved by an Expert!
Get step-by-step solutions from verified subject matter experts
Step: 2 Unlock
Step: 3 Unlock