

Question: Hello I ' m struggling with part d . ive attached an image of the question. can you please show me how to solve for
Hello Im struggling with part d ive attached an image of the question. can you please show me how to solve for question d using goal seek step by step and exactly which coloums i need to select in order to acieve the correct answer.
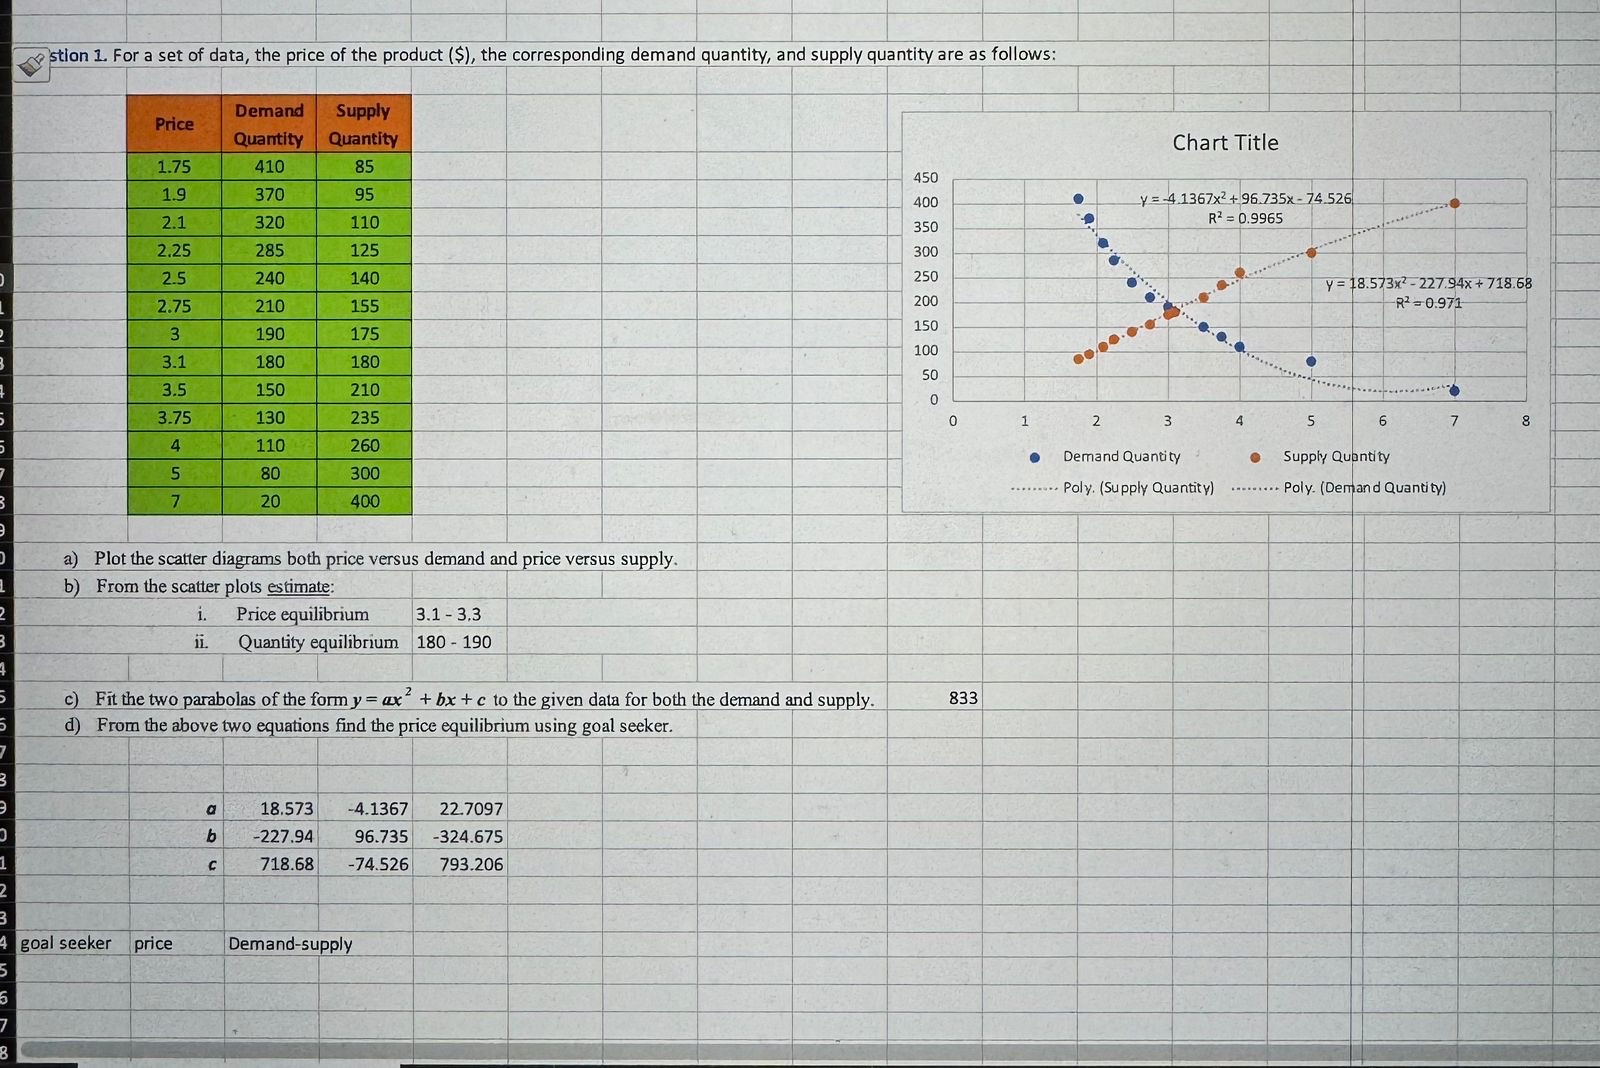
For a set of data, the price of the product $ the corresponding demand quantity, and supply quantity are as follows:
tablePricetableDemandQuantitytableSupplyQuantity
a Plot the scatter diagrams both price versus demand and price versus supply.
b From the scatter plots estimate:
i Price equilibrium
ii Quantity equilibrium
c Fit the two parabolas of the form to the given data for both the demand and supply.
d From the above two equations find the price equilibrium using goal seeker.
table
goal seeker
price
Demandsupply
Step by Step Solution
There are 3 Steps involved in it
1 Expert Approved Answer
Step: 1 Unlock

Question Has Been Solved by an Expert!
Get step-by-step solutions from verified subject matter experts
Step: 2 Unlock
Step: 3 Unlock