

Question: Hello. I need help creating quality control charts for this data on excel. It shows 5 groups counting the colors of M&Ms in 5 packs,
Hello. I need help creating quality control charts for this data on excel. It shows 5 groups counting the colors of M&Ms in 5 packs, how do I create these charts? It doesn't work my UCL and LCLs don't work. Does it have to be for each group or all together?
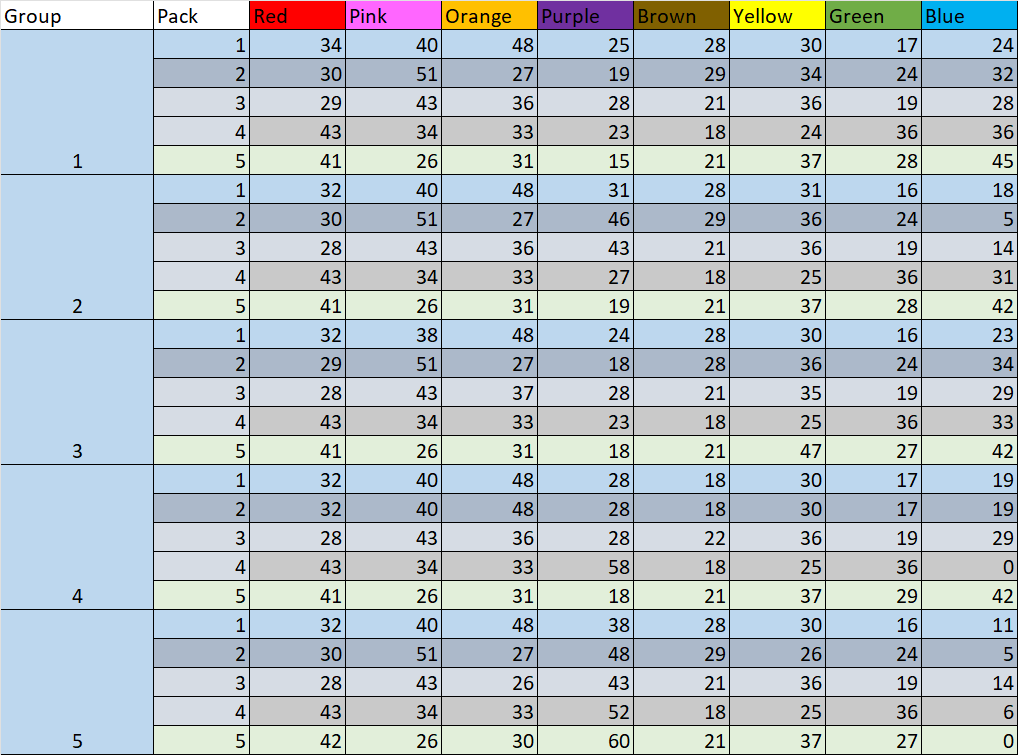
Group Pack Red Pink Orange Purple Brown Yellow Green Blue 34 40 48 25 28 30 17 24 2 30 51 27 19 29 34 24 32 3 29 43 36 28 21 36 19 28 43 34 33 23 18 24 36 36 5 41 26 31 15 21 37 28 45 32 40 48 31 28 31 16 18 N 30 51 27 46 29 36 24 5 W 28 43 36 43 21 36 19 14 43 34 33 27 18 25 36 31 2 5 41 26 31 19 21 37 28 42 32 38 48 24 28 30 16 23 29 51 27 18 28 36 24 34 WU 28 43 37 28 21 35 19 29 43 34 33 23 18 25 36 33 41 26 31 18 21 47 27 42 32 40 48 28 18 30 17 19 32 40 48 28 18 30 17 19 3 28 43 36 28 22 36 19 29 43 34 33 58 18 25 36 0 4 UT 41 26 31 18 21 37 29 42 32 40 48 38 28 30 16 11 30 51 27 48 29 26 24 5 W 28 43 26 43 21 36 19 14 4 43 34 33 52 18 25 36 6 5 5 42 26 30 60 21 37 27 0
Step by Step Solution
There are 3 Steps involved in it

Get step-by-step solutions from verified subject matter experts