

Question: Hello, I need help figuring out how to code a plot for my data. I have 65535 rows of data. My goal is to do
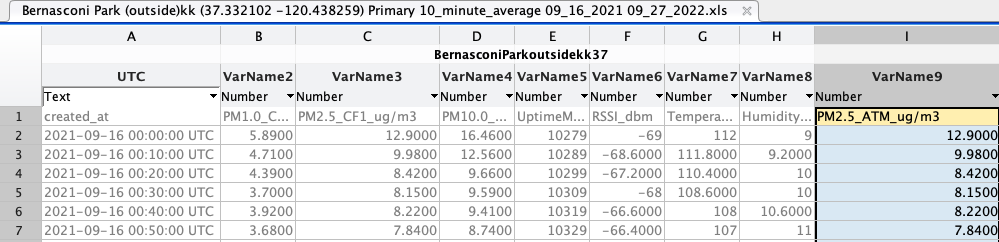 Hello, I need help figuring out how to code a plot for my data. I have 65535 rows of data. My goal is to do a concentration for the y - axis and x-axis for time. How do I plot this with MATLAB?
Bernasconi Park (outside)kk (37.332102 -120.438259) Primary 10_minute_average 09_16_2021 09_27_2022.xls
Step by Step Solution
There are 3 Steps involved in it
1 Expert Approved Answer
Step: 1 Unlock

Question Has Been Solved by an Expert!
Get step-by-step solutions from verified subject matter experts
Step: 2 Unlock
Step: 3 Unlock