

Question: please use matlab to solve Problem 10.4 Goal: Predict oxygen concentrations based on the relationship between oxygen concentration and temperature. The oxygen concentration 0 (mg/L)
please use matlab to solve
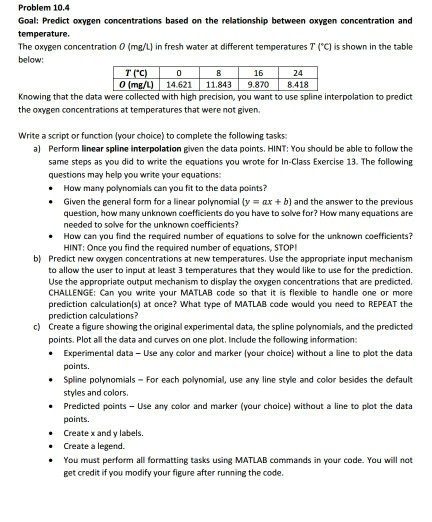
Problem 10.4 Goal: Predict oxygen concentrations based on the relationship between oxygen concentration and temperature. The oxygen concentration 0 (mg/L) in fresh water at different temperatures T ("C) is shown in the table below: 16 24 0 (mEL) 14.621 11.843 9.870 8418 Knowing that the data were collected with high precision, you want to use spline interpolation to predict the oxygen concentrations at temperatures that were not given. Write a script or function (your choice) to complete the following tasks a) Perform linear spline interpolation given the data points, HINT: You should be able to follow the same steps as you did to write the equations you wrote for In-Class Exercise 13. The following questions may help you write your equations: How many polynomials can you fit to the data points? Given the general form for a linear polynoma1(y needed to solve for the unknown coefficients? HINT: Once you find the required number of equations, STOP ?? + b) and the answer to the previous * question, how many unknown coefficients do you have to solve for? How many equations are How can you find the required number of equations to solve for the unknown coefficients? b) Predict new oxygen concentrations at new temperatures, Use the appropriate input mechanism to allow the user to input at least 3 temperatures that they would like to use for the prediction. Use the appropriate output mechanism to display the oxygen concentrations that are predicted CHALLENGE: Can you write your MATLAB code so that it is flexible to handle one or more prediction calculationfs) at once? What type of MATLAB code would you need to REPEAT the c) Create a figure showing the original experimental data, the spline polynomials, and the predicted Experimental data - Use any color and marker (your choice) without a line to plot the data . Spline polynomials For each polynomial, use any line style and color besides the default . Predicted points - Use any color and marker (your choice) without a line to plot the data prediction calculations points. Plot all the data and curves on one plot. Include the following information points. styles and colors. Create x and y labels. Create a legend. * . You must perform all formatting tasks using MATLAB commands in your code. You will not get credit if you modify your figure after running the code Problem 10.4 Goal: Predict oxygen concentrations based on the relationship between oxygen concentration and temperature. The oxygen concentration 0 (mg/L) in fresh water at different temperatures T ("C) is shown in the table below: 16 24 0 (mEL) 14.621 11.843 9.870 8418 Knowing that the data were collected with high precision, you want to use spline interpolation to predict the oxygen concentrations at temperatures that were not given. Write a script or function (your choice) to complete the following tasks a) Perform linear spline interpolation given the data points, HINT: You should be able to follow the same steps as you did to write the equations you wrote for In-Class Exercise 13. The following questions may help you write your equations: How many polynomials can you fit to the data points? Given the general form for a linear polynoma1(y needed to solve for the unknown coefficients? HINT: Once you find the required number of equations, STOP ?? + b) and the answer to the previous * question, how many unknown coefficients do you have to solve for? How many equations are How can you find the required number of equations to solve for the unknown coefficients? b) Predict new oxygen concentrations at new temperatures, Use the appropriate input mechanism to allow the user to input at least 3 temperatures that they would like to use for the prediction. Use the appropriate output mechanism to display the oxygen concentrations that are predicted CHALLENGE: Can you write your MATLAB code so that it is flexible to handle one or more prediction calculationfs) at once? What type of MATLAB code would you need to REPEAT the c) Create a figure showing the original experimental data, the spline polynomials, and the predicted Experimental data - Use any color and marker (your choice) without a line to plot the data . Spline polynomials For each polynomial, use any line style and color besides the default . Predicted points - Use any color and marker (your choice) without a line to plot the data prediction calculations points. Plot all the data and curves on one plot. Include the following information points. styles and colors. Create x and y labels. Create a legend. * . You must perform all formatting tasks using MATLAB commands in your code. You will not get credit if you modify your figure after running the code
Step by Step Solution
There are 3 Steps involved in it

Get step-by-step solutions from verified subject matter experts