

Question: Hello - I need help in understanding the below questions. Can you please provide explanation. Many thanks! Problem 2. Data and Descriptive Statistics. [8 points]
Hello - I need help in understanding the below questions. Can you please provide explanation. Many thanks!
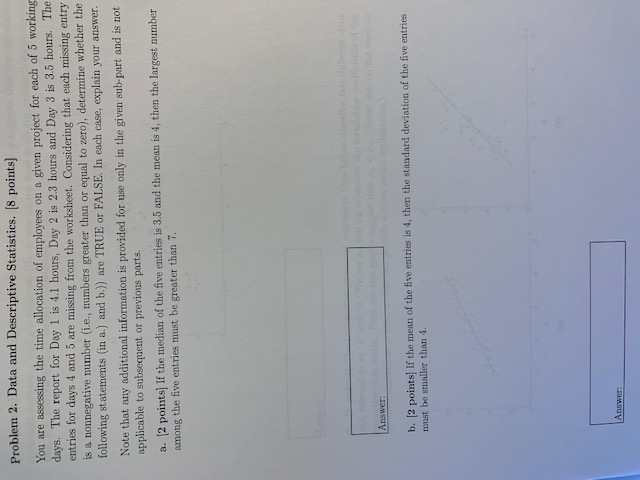
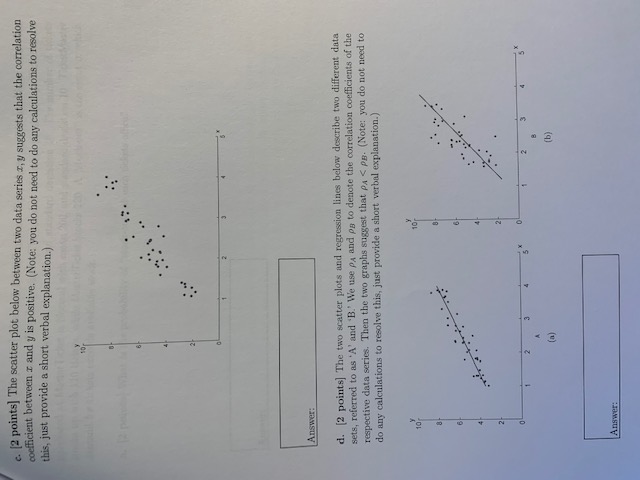
Problem 2. Data and Descriptive Statistics. [8 points] You are assessing the time allocation of employees on a given project for each of 5 working days. The report for Day 1 is 4.1 hours, Day 2 is 2.3 hours and Day 3 is 3.5 hours. The entries for days 4 and 5 are missing from the worksheet. Considering that each missing entry is a nonnegative number (i.e., numbers greater than or equal to zero), determine whether the following statements (in a.) and b.)) are TRUE or FALSE. In each case, explain your answer. Note that any additional information is provided for use only in the given sub-part and is not applicable to subsequent or previous parts. a. [2 points] If the median of the five entries is 3.5 and the mean is 4, then the largest number among the five entries must be greater than 7. Answer: b. [2 points] If the mean of the five entries is 4, then the standard deviation of the five entries must be smaller than 4. Answer:c. [2 points] The scatter plot below between two data series r, y suggests that the correlation coefficient between r and y is positive. (Note: you do not need to do any calculations to resolve this, just provide a short verbal explanation.) 3 Answer: d. [2 points] The two scatter plots and regression lines below describe two different data sets, referred to as 'A' and "B." We use pa and py to denote the correlation coefficients of the respective data series. Then the two graphs suggest that pa
Step by Step Solution
There are 3 Steps involved in it

Get step-by-step solutions from verified subject matter experts