

Question: Hello, I need help on this. IM STUCK 6. The following data was extracted from the 1974 Motor Trend US magazine, and com- prises fuel
Hello, I need help on this. IM STUCK
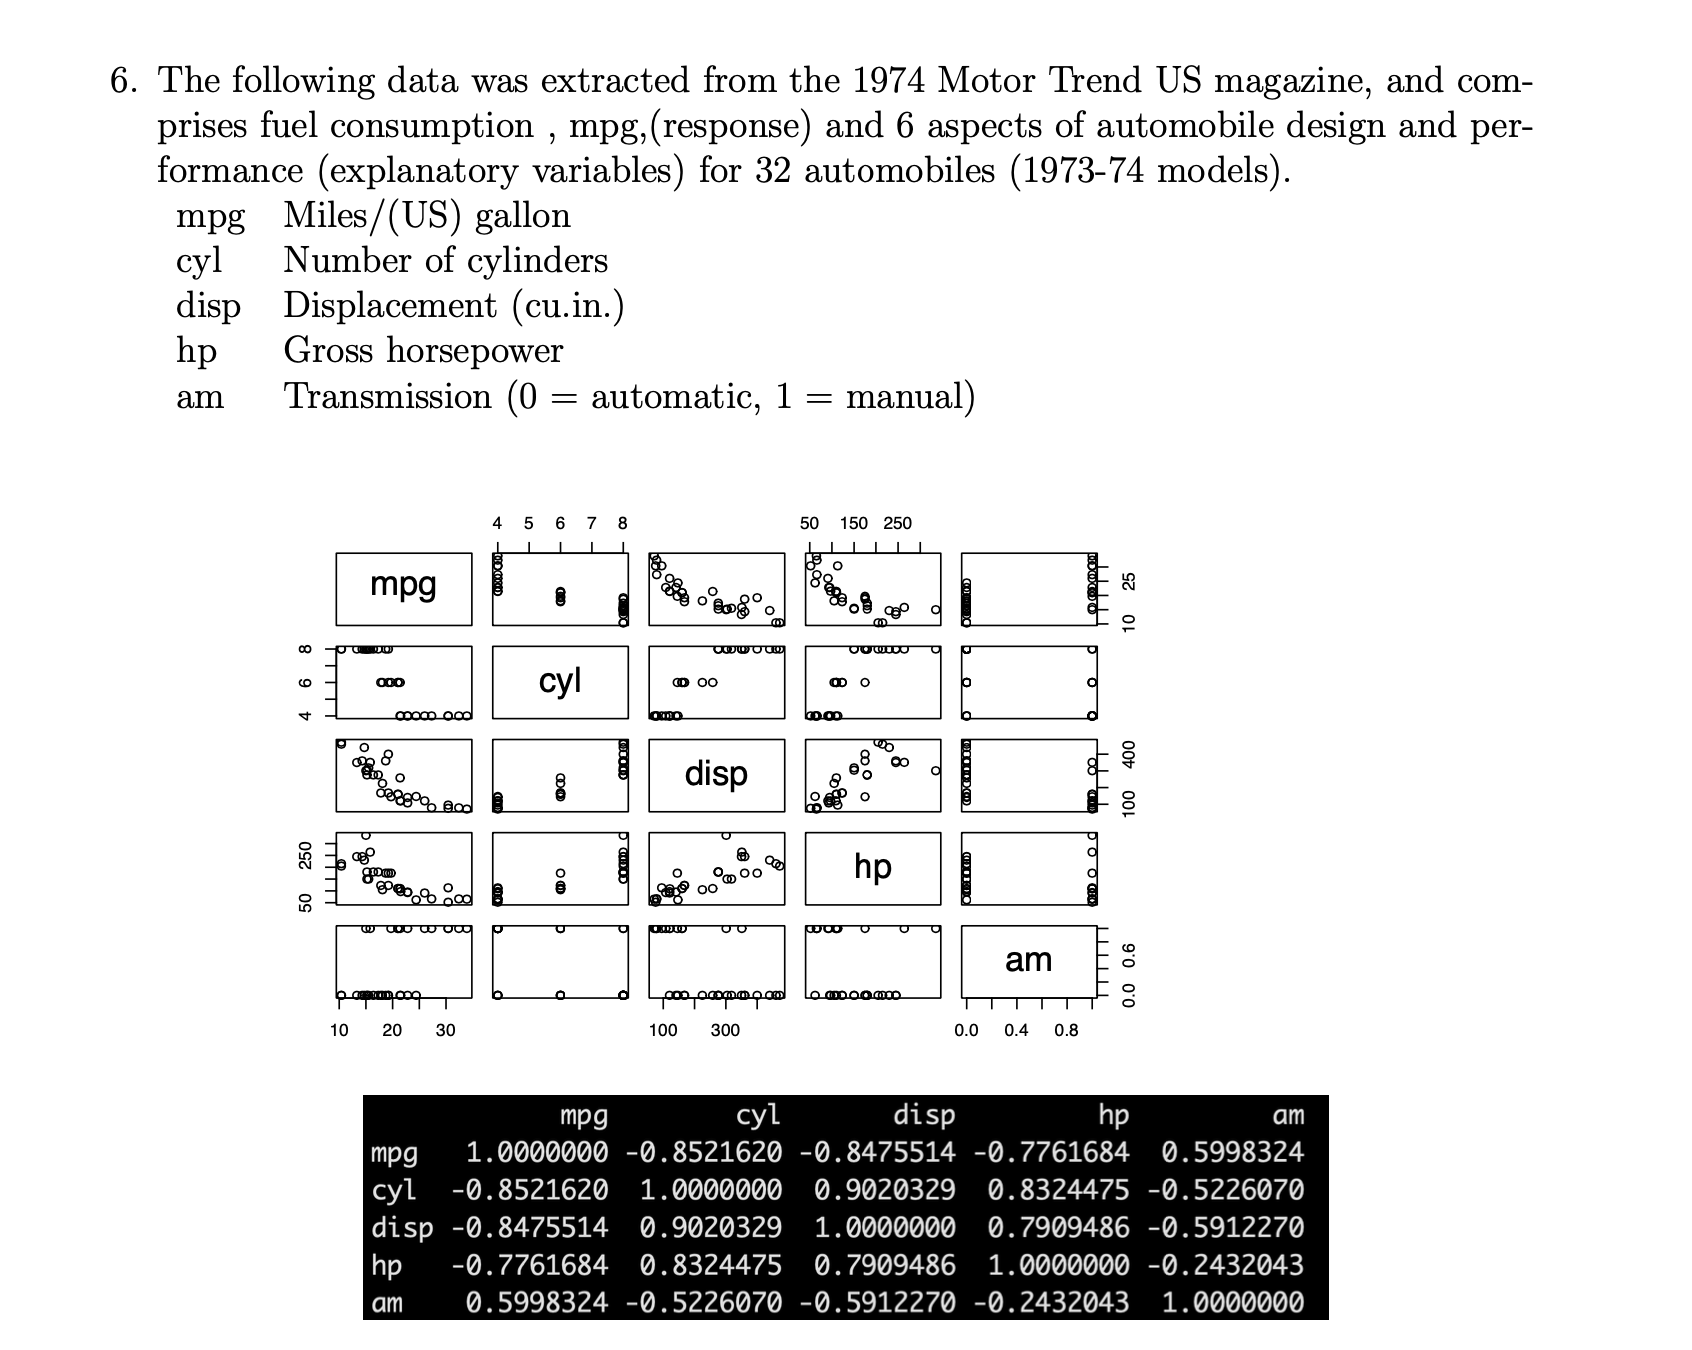
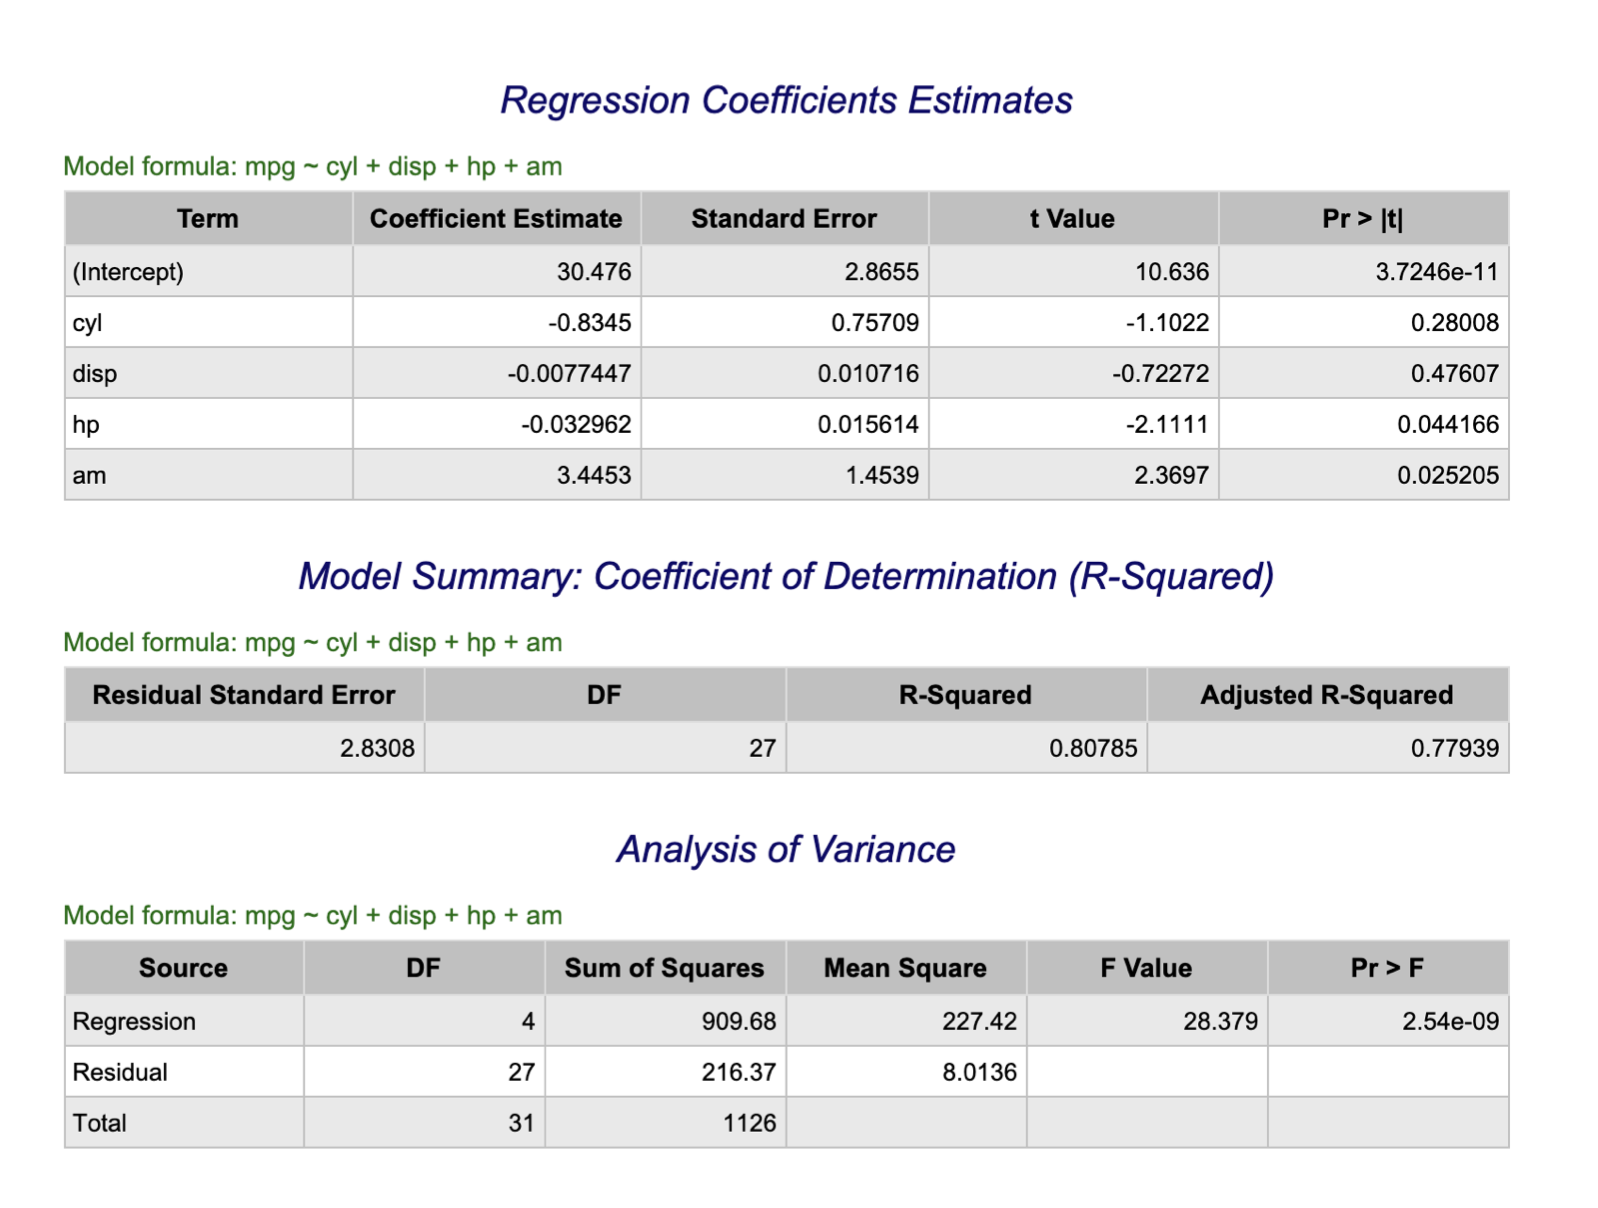
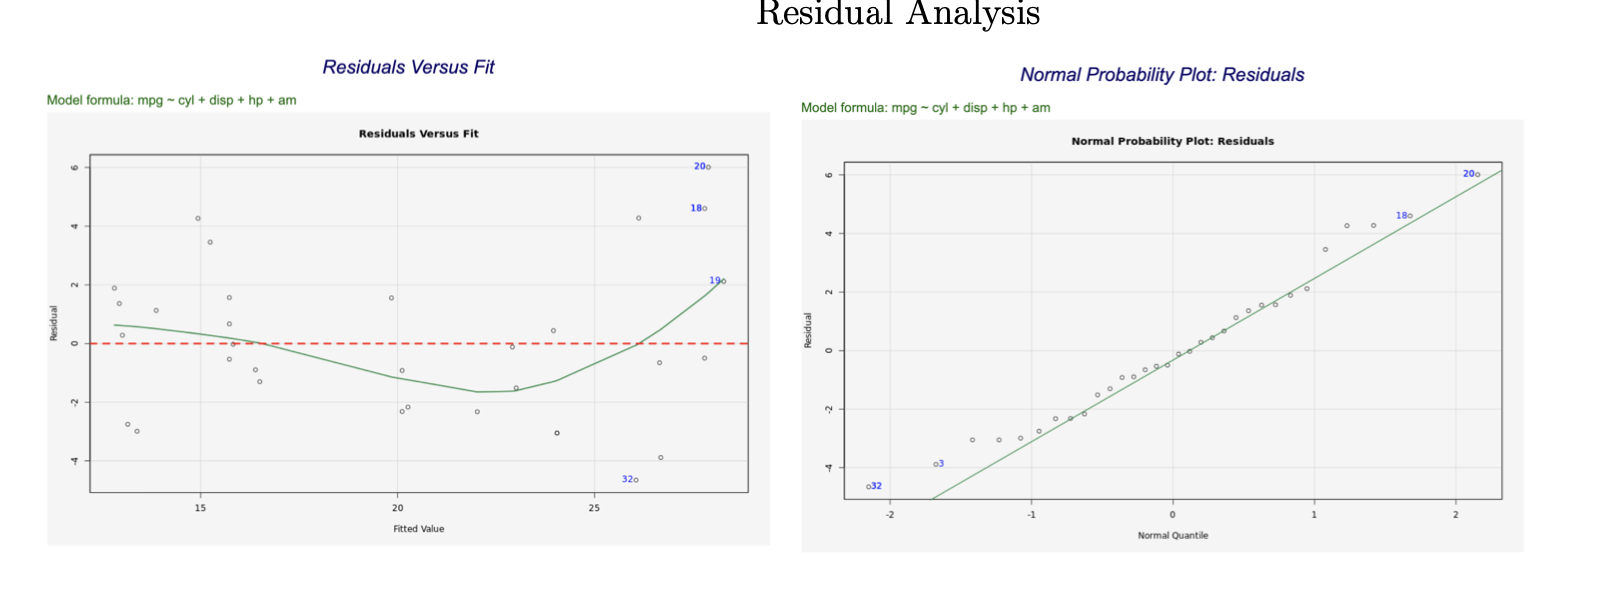
6. The following data was extracted from the 1974 Motor Trend US magazine, and com- prises fuel consumption , mpg, (response) and 6 aspects of automobile design and per- formance (explanatory variables) for 32 automobiles (1973-74 models). mpg Miles/(US) gallon cyl Number of cylinders disp Displacement (cu.in.) hp Gross horsepower am Transmission (0 = automatic, 1 = manual) 4 5 6 8 50 150 250 mpg 25 10 4 6 cyl D OO o disp OC 100 400 250 o hp mood am Lo mDoomED 0.0 0.6 10 20 30 100 300 0.0 0.4 0.8 mpg cyl disp hp am mpg 1.0000000 -0. 8521620 -0.8475514 -0.7761684 0.5998324 cyl -0. 8521620 1.0000000 0.9020329 0. 8324475 -0.5226070 disp -0. 8475514 0.9020329 1. 0000000 0. 7909486 -0.5912270 hp -0. 7761684 0. 8324475 0. 7909486 1.0000000 -0.2432043 am 0. 5998324 -0.5226070 -0.5912270 -0.2432043 1.0000000Regression Coefficients Estimates Model formula: mpg ~ cyl + disp + hp + am Term Coefficient Estimate Standard Error t Value Pr > It| (Intercept) 30.476 2.8655 10.636 3.7246e-11 cyl -0.8345 0.75709 -1.1022 0.28008 disp -0.0077447 0.010716 -0.72272 0.47607 hp -0.032962 0.015614 -2. 1111 0.044166 am 3.4453 1.4539 2.3697 0.025205 Model Summary: Coefficient of Determination (R-Squared) Model formula: mpg ~ cyl + disp + hp + am Residual Standard Error DF R-Squared Adjusted R-Squared 2.8308 27 0.80785 0.77939 Analysis of Variance Model formula: mpg ~ cyl + disp + hp + am Source DF Sum of Squares Mean Square F Value Pr > F Regression 4 909.68 227.42 28.379 2.54e-09 Residual 27 216.37 8.0136 Total 31 1126Residual Analysis Residuals Versus Fit Normal Probability Plot: Residuals Model formula: mpg ~ cyl + disp + hp + am Model formula: mpg ~ cyl + disp + hp + am Residuals Versus Fit Normal Probability Plot: Residuals 200 20o 180 180 o N Residual O Residual 03 320 032 15 20 25 Fitted Value Normal Quantile
Step by Step Solution
There are 3 Steps involved in it

Get step-by-step solutions from verified subject matter experts