

Question: Hello. I need help solving the problem below. If you could provide detailed explanations and calculations to show me how to arrive at the correct
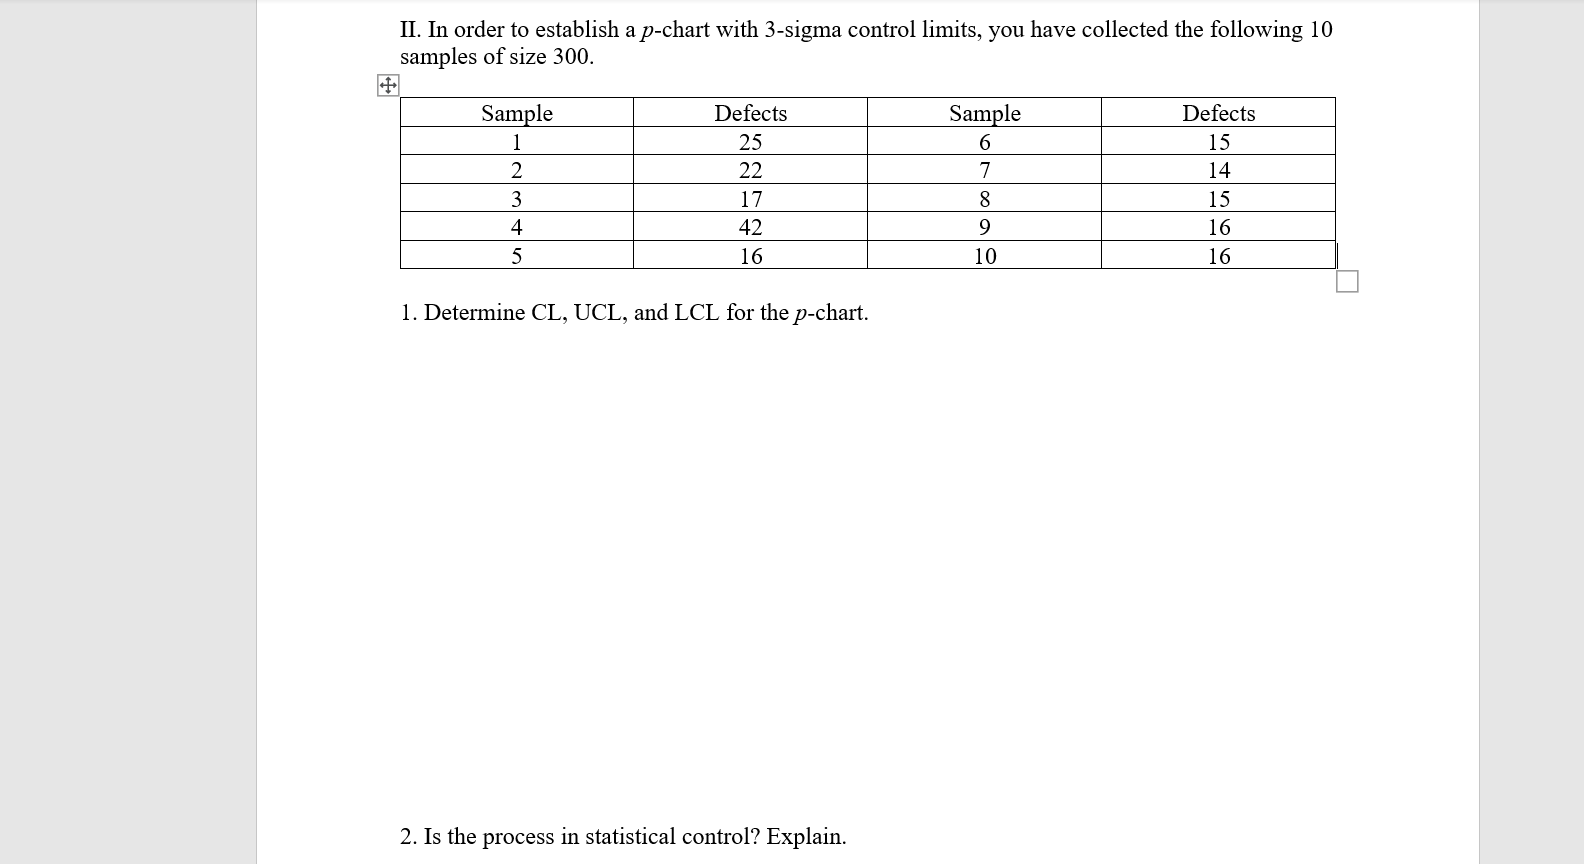
Hello. I need help solving the problem below. If you could provide detailed explanations and calculations to show me how to arrive at the correct result, I would greatly appreciate it.
Also, please provide your explanations and calculations in Word or Excel as it is easier for me to read than handwriting. Thank you again.
Step by Step Solution
There are 3 Steps involved in it
1 Expert Approved Answer
Step: 1 Unlock

Question Has Been Solved by an Expert!
Get step-by-step solutions from verified subject matter experts
Step: 2 Unlock
Step: 3 Unlock