

Question: Hello, I need help with part b, thank you The Digital Guardian Company issues policies that protect clients from downtime costs due to computer system
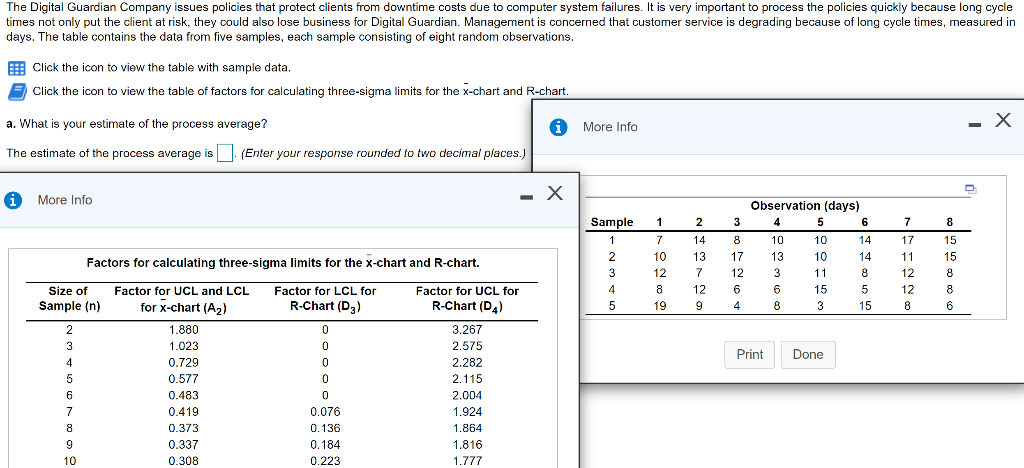
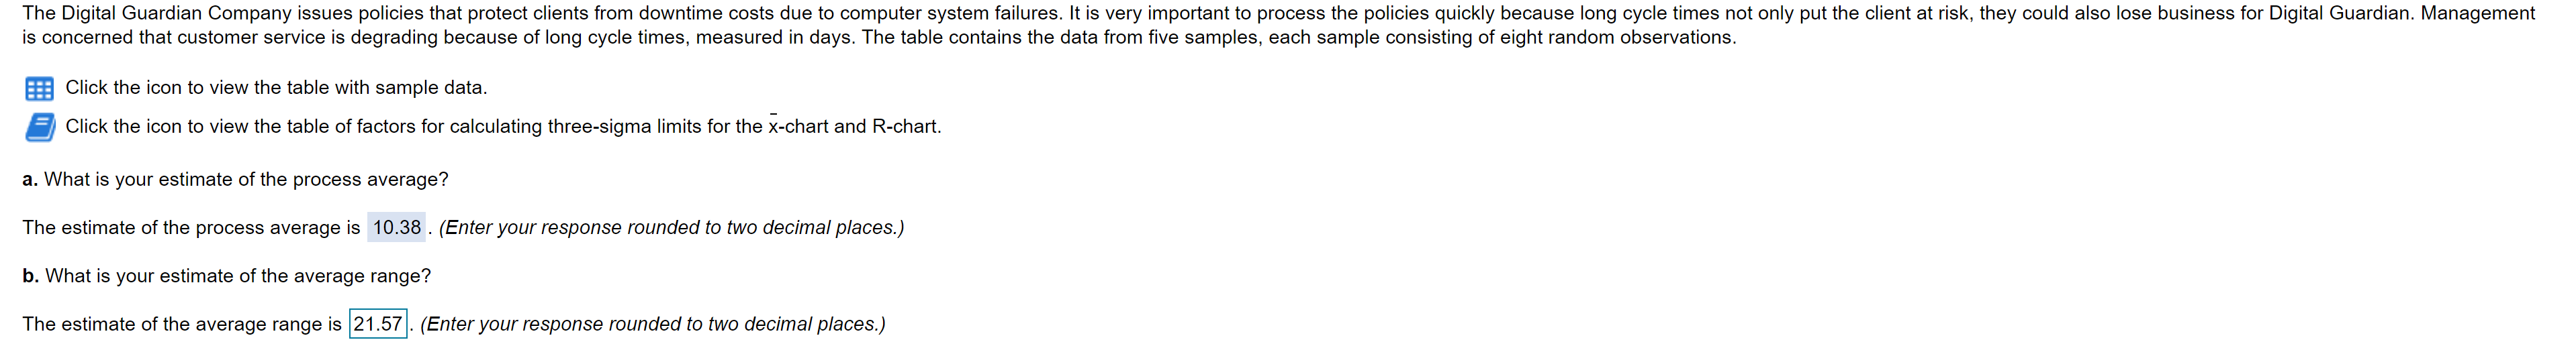 Hello, I need help with part b, thank you
Step by Step Solution
There are 3 Steps involved in it
1 Expert Approved Answer
Step: 1 Unlock

Question Has Been Solved by an Expert!
Get step-by-step solutions from verified subject matter experts
Step: 2 Unlock
Step: 3 Unlock