

Question: Hello, I need help with these following statistics problems we din't fully cover the topics in class with or teacher: Please find them down below:
Hello,
I need help with these following statistics problems we din't fully cover the topics in class with or teacher:
Please find them down below:
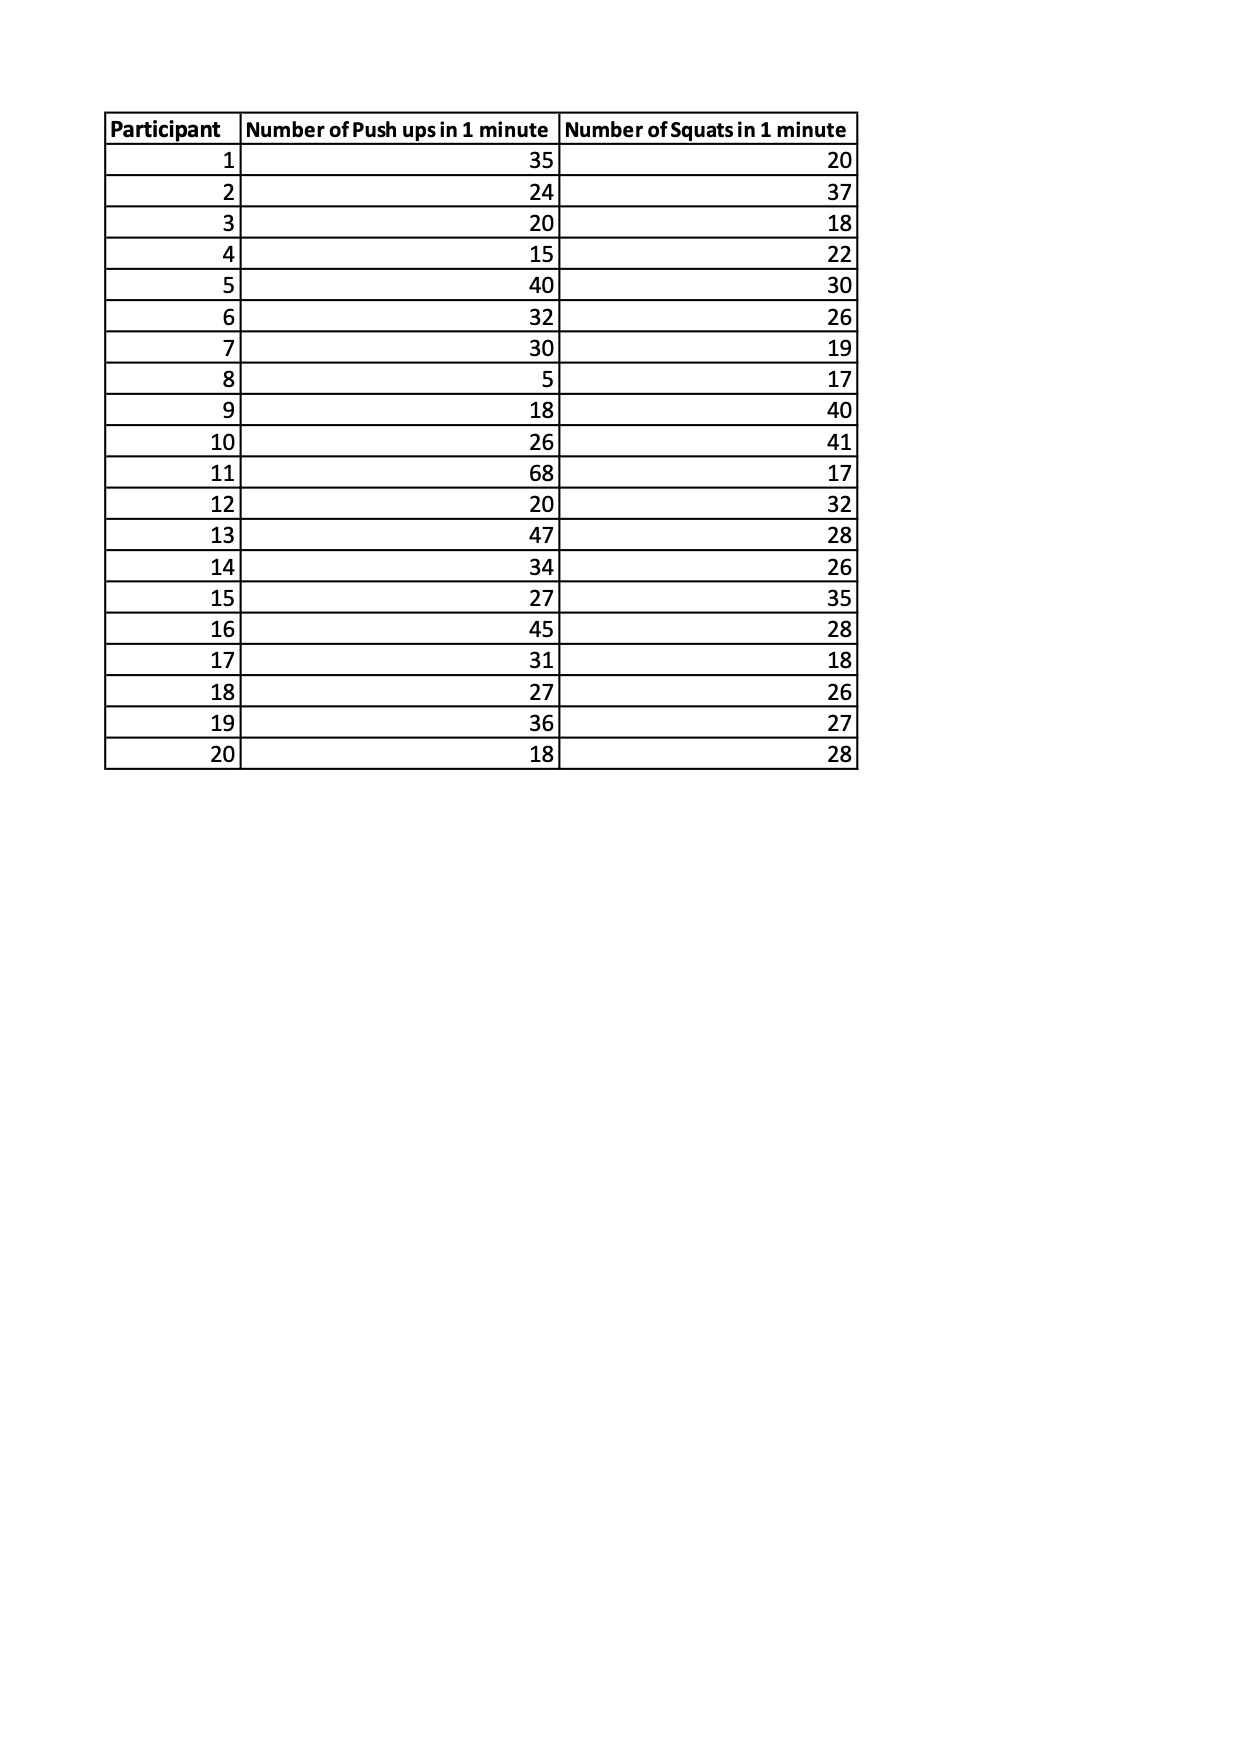
Participant Number of Push ups in 1 minute Number of Squats in 1 minute 35 20 24 37 20 18 15 22 40 30 32 26 30 19 5 17 18 40 26 41 68 17 20 32 47 28 34 26 27 35 16 45 28 17 31 18 18 27 26 19 36 27 20 18 28Problem #3 As part of a research study on a new 4-week strength training program, a kinesiologist records the number of push-ups and number of squats participants can complete in one-minute on training day one, as an indicator of their baseline strength. A) Visualize the data. Ensure your graph is labelled appropriately (e.g., axes, title, legend). (2 marks) B) Write a brief statement describing the figure and explain your rationale for the type of visualization you selected. (2 marks) C) Consider whether there are any potential outliers in this data set. Check for outliers using the interquartile range technique and describe your findings (2 marks) D) Consider whether there are any potential outliers in this data set. Check for outliers using standard deviation technique and describe your findings (2 marks) E) Describe how you would decide whether to keep or remove any potential outliers in a data set (2 marks) Problem #2 In the researcher's second Spinning Dancer experiment, the participants watched the spinning dancer for 65 seconds and were asked to press a keyboard key the first time they thought the dancer switched directions. T A) Create an absolute frequency table using the following intervals: (1 mark) 0.0 9.95 10.0 19.95 20.0 29.95 30.0 39.95 40.0 - 49.95 50.0 59.95 60.0 69.95 Frt'F'P-FP'P B) Visualize the data using the above intervals. Ensure your graph is labelled appropriately (e.g., axes, title, legend). (2 marks) C) Write a brief statement describing the figure and explain your rationale for the type of visualization you selected. (2 marks) Module 02 Homework The data for Module 02 homework can be found as a separate le in the resources section. Problem #1 A researcher uses the Spinning Dancer graphic to study perception and visual spatial ability. Click the following link to watch the spinning dancer graphic: htt : www. rocreo.' labo lab013.htm| In the researcher's first Spinning Dancer experiment, they asked participants if they thought the dancer was spinning clockwise (A) or counter-clockwise (B). A) Identify the level of measurement in this experiment. (1 mark) B) Visualize the data showing the clockwise data in black and the counter-clockwise data in gray. Ensure your graph is labelled appropriately (e.g., axes, title, legend). (2 marks) C) Write a brief statement describing the gure and explain your rationale for the type of visualization you selected. (2 marks)
Step by Step Solution
There are 3 Steps involved in it

Get step-by-step solutions from verified subject matter experts