

Question: Hello, I need help with this one. I started it but I need help finishing. Please check my answers Construct a frequency distribution using the
Hello, I need help with this one. I started it but I need help finishing. Please check my answers
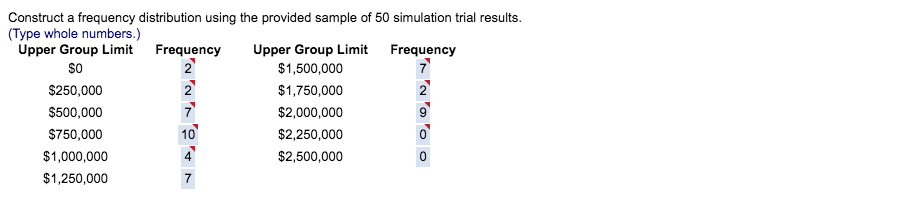
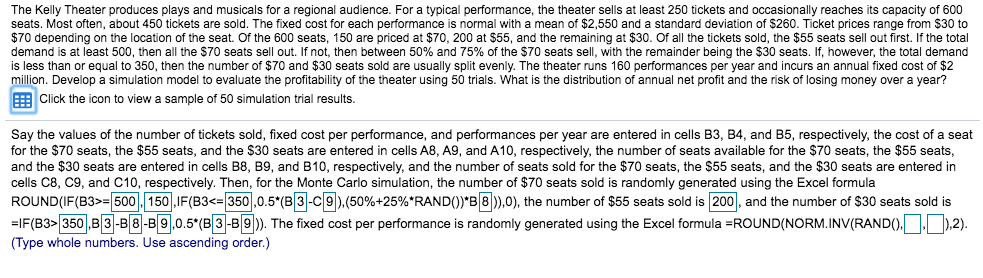
Construct a frequency distribution using the provided sample of 50 simulation trial results; (Type whole numbers.) Upper Group Limit Frequency Upper Group Limit Frequency $0 2' $1,500,000 2" $250,000 2' $1,750,000 2' $500,000 1" $2,000,000 2' $250,000 10' $2,250,000 0' $1,000,000 4' $2,500,000 0 $1,250,000 2 The Kelly Theater produces plays and musicals for a regional audience. For a typical performance, the theater sells at least 250 tickets and occasionally reaches its capacity of 600 seats. Most often, about 450 tickets are sold. The fixed cost for each performance is normal with a mean of $2,550 and a standard deviation of $260. Ticket prices range from $30 to $70 depending on the location of the seat. Of the 600 seats, 150 are priced at $70, 200 at $55, and the remaining at $30. Of all the tickets sold, the $55 seats sell out first. If the total demand is at least 500, then all the $70 seats sell out. If not, then between 50% and 75% of the $70 seats sell, with the remainder being the $30 seats. If, however, the total demand is less than or equal to 350, then the number of $70 and $30 seats sold are usually split evenly. The theater runs 160 performances per year and incurs an annual fixed cost of $2 million. Develop a simulation model to evaluate the profitability of the theater using 50 trials. What is the distribution of annual net profit and the risk of losing money over a year? Click the icon to view a sample of 50 simulation trial results. Say the values of the number of tickets sold, fixed cost per performance, and performances per year are entered in cells B3, B4, and B5, respectively, the cost of a seat for the $70 seats, the $55 seats, and the $30 seats are entered in cells A8, A9, and A10, respectively, the number of seats available for the $70 seats, the $55 seats, and the $30 seats are entered in cells B8, B9, and B10, respectively, and the number of seats sold for the $70 seats, the $55 seats, and the $30 seats are entered in cells C8, C9, and C10, respectively. Then, for the Monte Carlo simulation, the number of $70 seats sold is randomly generated using the Excel formula ROUND(IF(B3>= 500 , 150 ,IF(B3350 ,B 3 -B 8 -B 9,0.5*(B 3)-B 9 )). The fixed cost per performance is randomly generated using the Excel formula =ROUND(NORM.INV(RAND(), ], ),2). (Type whole numbers. Use ascending order.)
Step by Step Solution
There are 3 Steps involved in it

Get step-by-step solutions from verified subject matter experts