

Question: Hello, I need help with this. Use the General Linear Model command to examine the effects of multiple independent variables on a dependent variable. Devise
Hello, I need help with this. Use the General Linear Model command to examine the effects of multiple independent variables on a dependent variable. Devise your research question so that it can be analyzed as a 2x2, 2x3, or 3x3 ANOVA. If your factor has more than 3 levels, you need to recode into fewer levels (groups) with the Transform into Different command or use the Select Cases command under the Datamenu. Your results must have at least one significant main effect or interaction.
The results must have at least one significant main effect or interaction. Is this output significant?
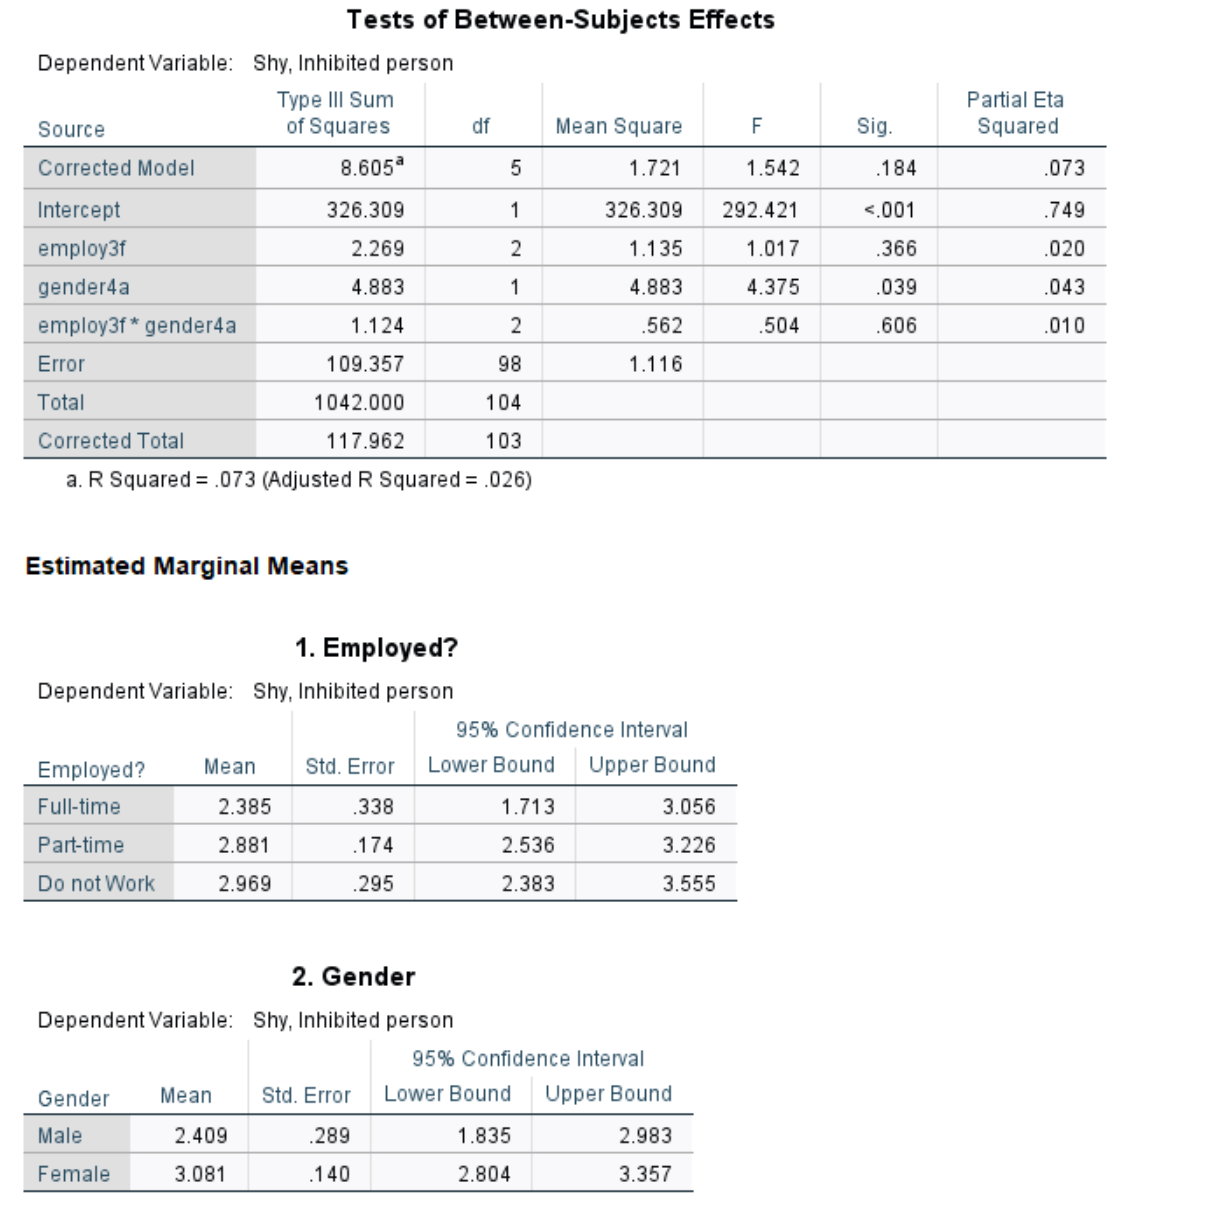
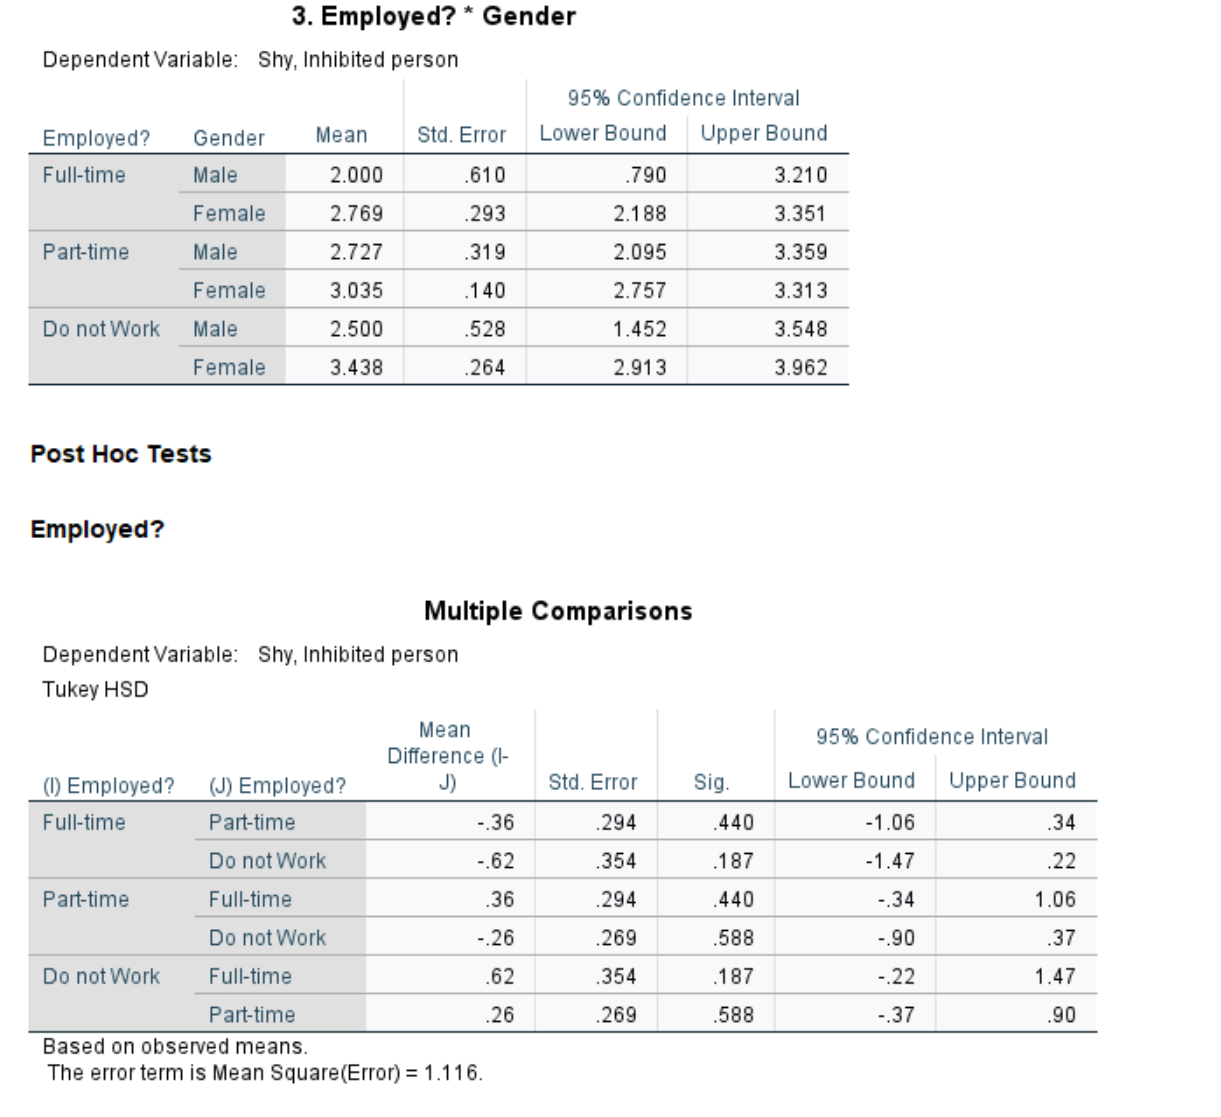
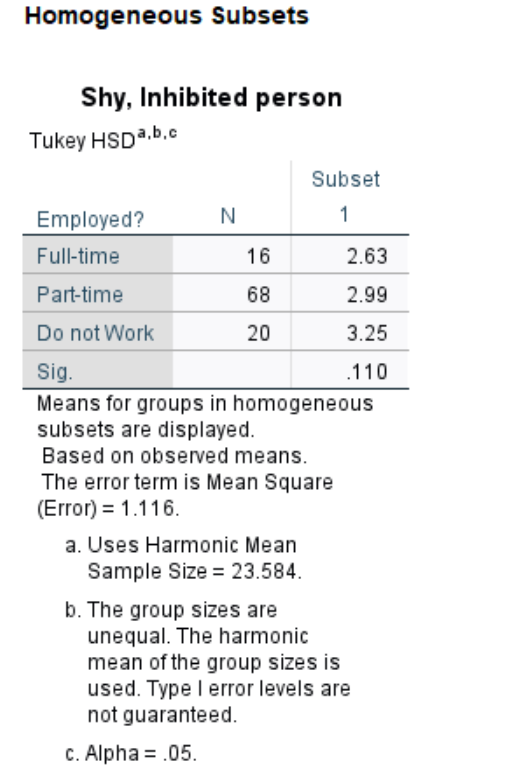
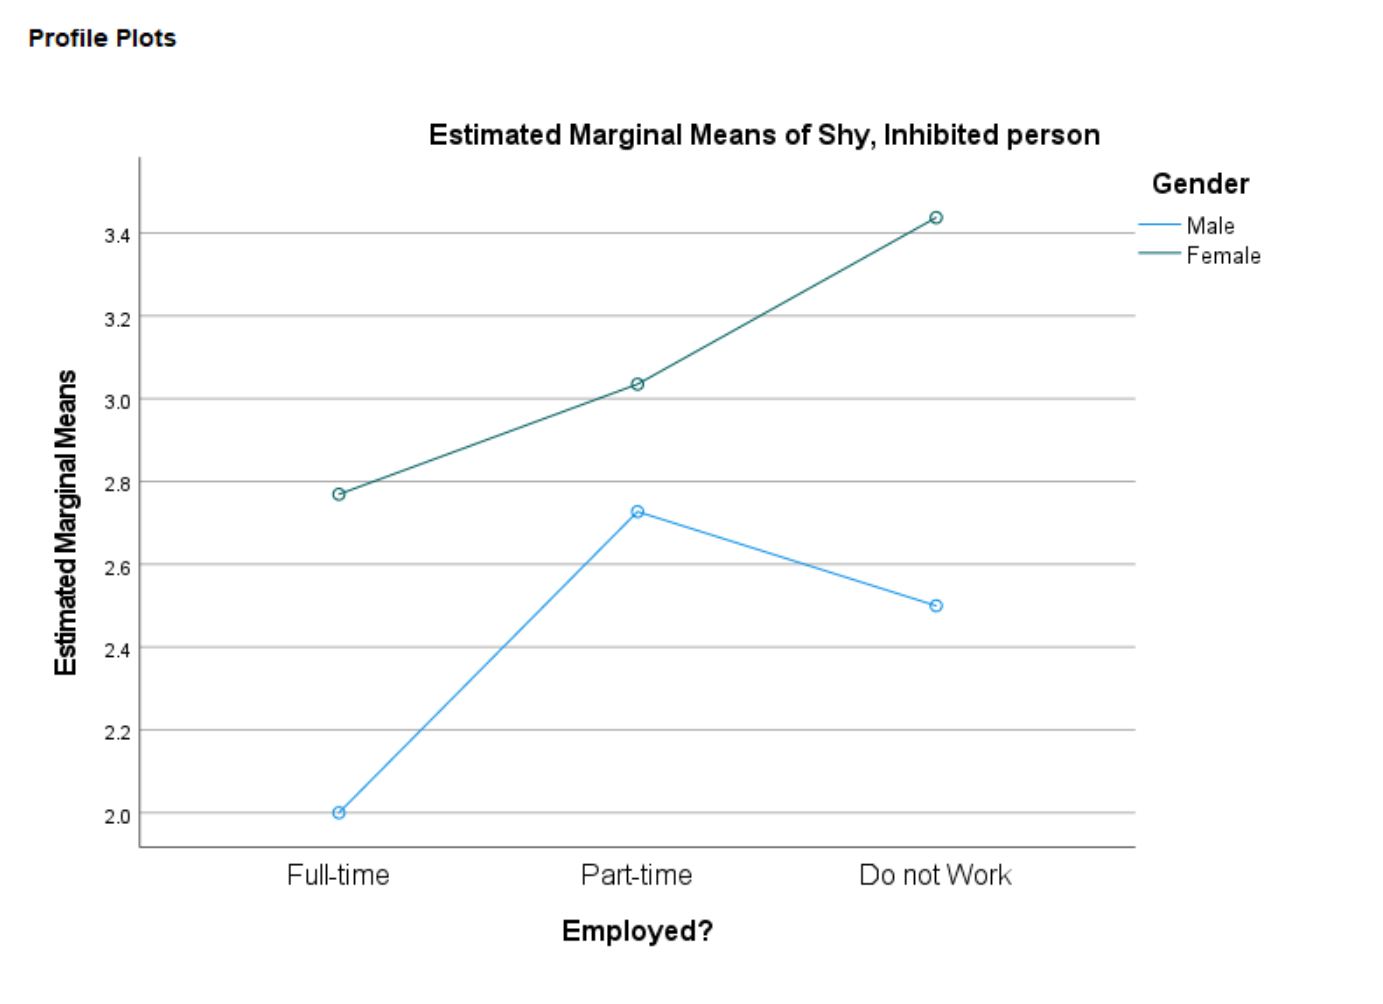
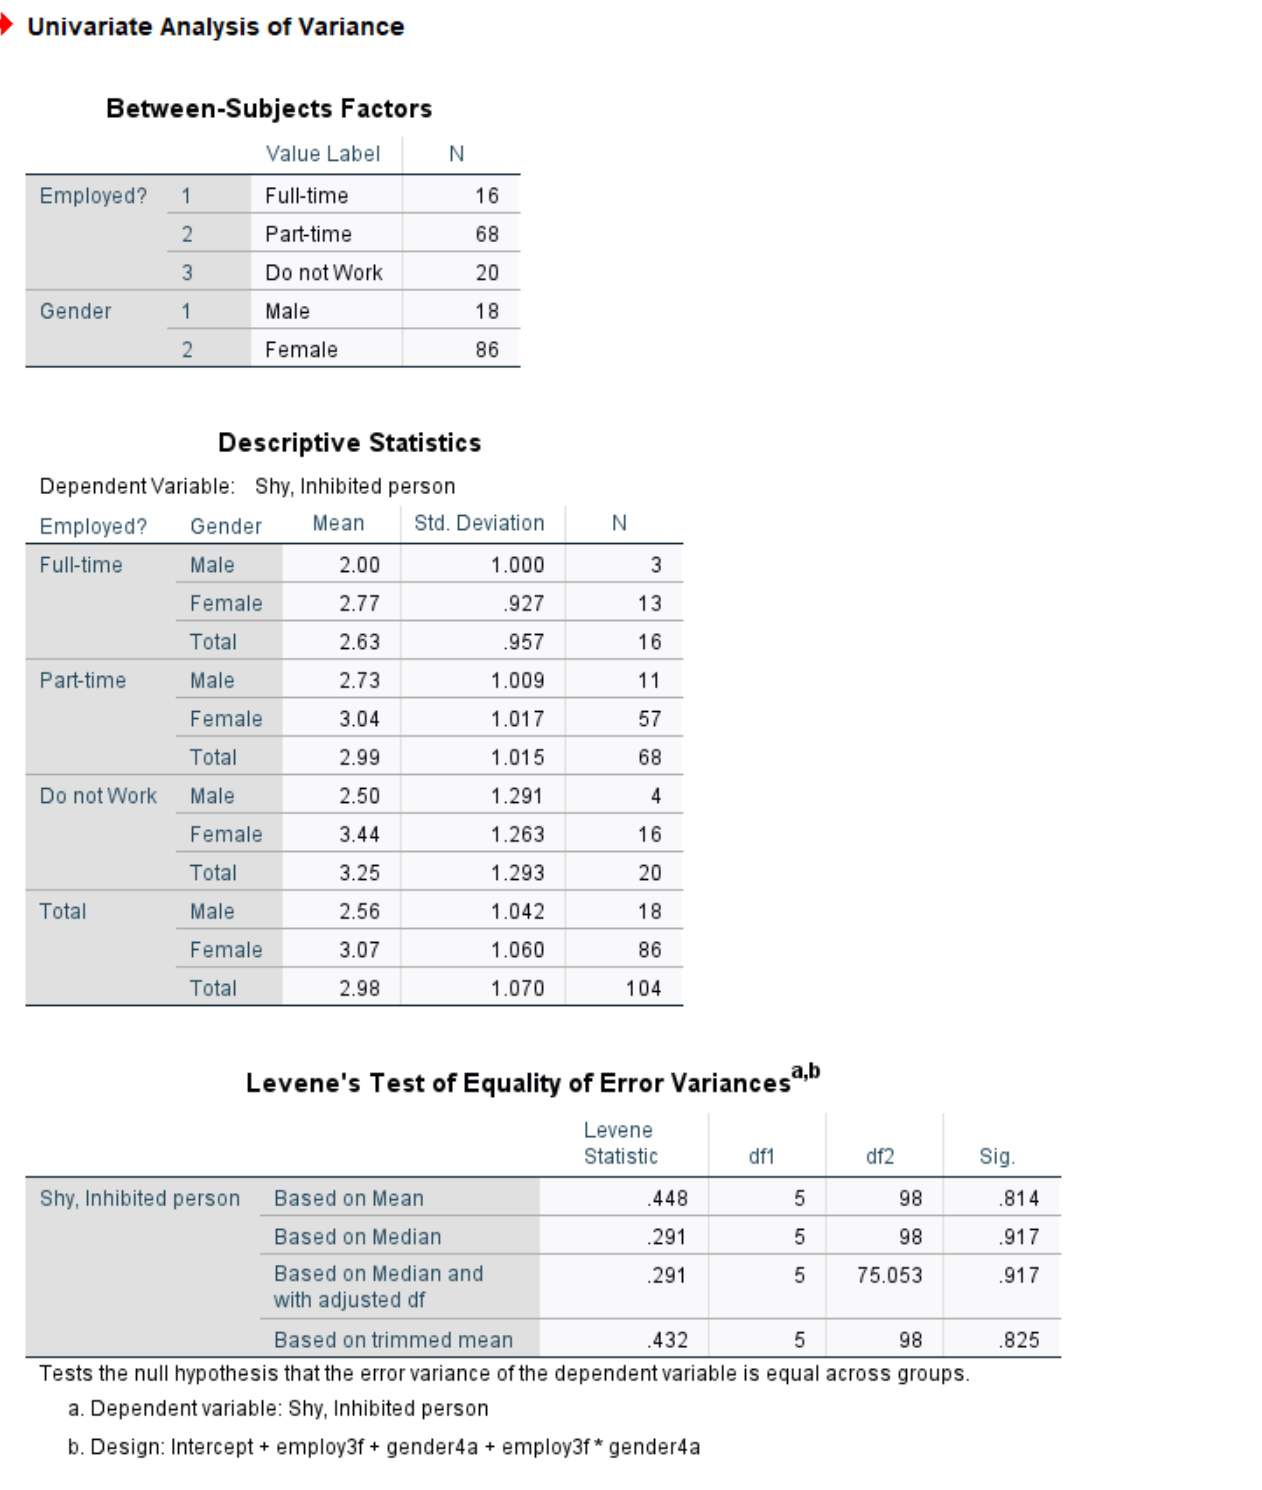
Tests of Between-Subjects Effects Dependent Variable: Shy, Inhibited person Type Ill Sum Partial Eta Source of Squares df Mean Square F Sig Squared Corrected Model 8.605 5 1.721 1.542 184 073 Intercept 326.309 326.309 292.421 <.001 employ3f n gender4a .562 .504 error total corrected a. r squared=".073" estimated marginal means employed dependent variable: shy inhibited person confidence interval mean std. lower bound upper full-time part-time do not work .295 gender male female .140 post hoc tests multiple comparisons tukey hsd difference j sig. .440 .34 .22 .36 .294 .588 .90 .37 .354 .187 .26 .269 ..37 based on observed means. the term is square subsets tukeyhsd subset pan-lime .110 for groups in homogeneous are displayed. errorterm uses harmonic sample size: in. group sizes unequal. ofthe used. type i levels guaranteed. c. alpha=".05." profile plots of pelttime univariate analysis variance between-subjects factors value label descriptive statistics deviation levene test equality variances statistic df1 df2 sig median .291 and .917 with adjusted df trimmed null hypothesis that variable equal across groups. b. design: intercept>
Step by Step Solution
There are 3 Steps involved in it

Get step-by-step solutions from verified subject matter experts