

Question: Hello I need some help with these questions below. All info is there. Thank You! 1. Using the TI-84 Plus calculator, find the area under
Hello I need some help with these questions below.
All info is there.
Thank You!
1.
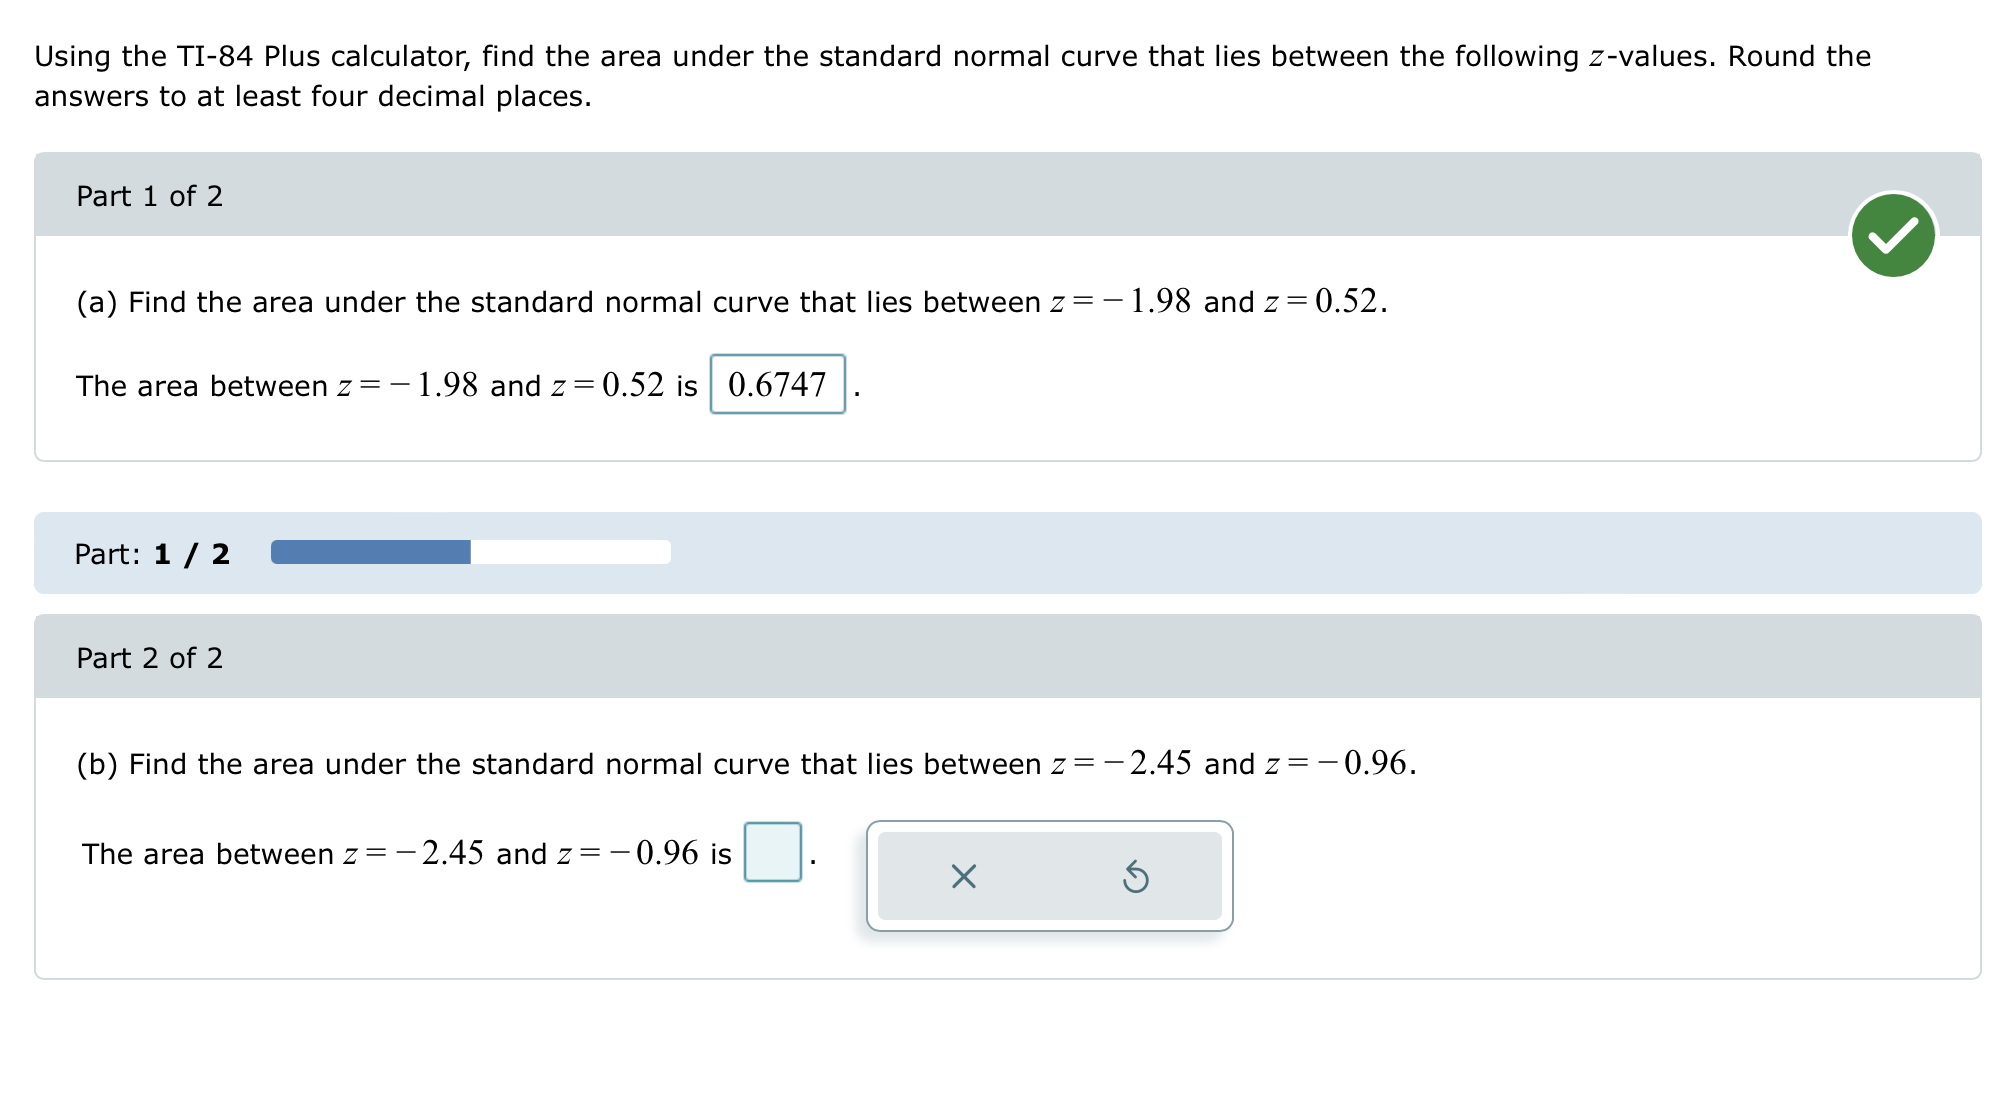
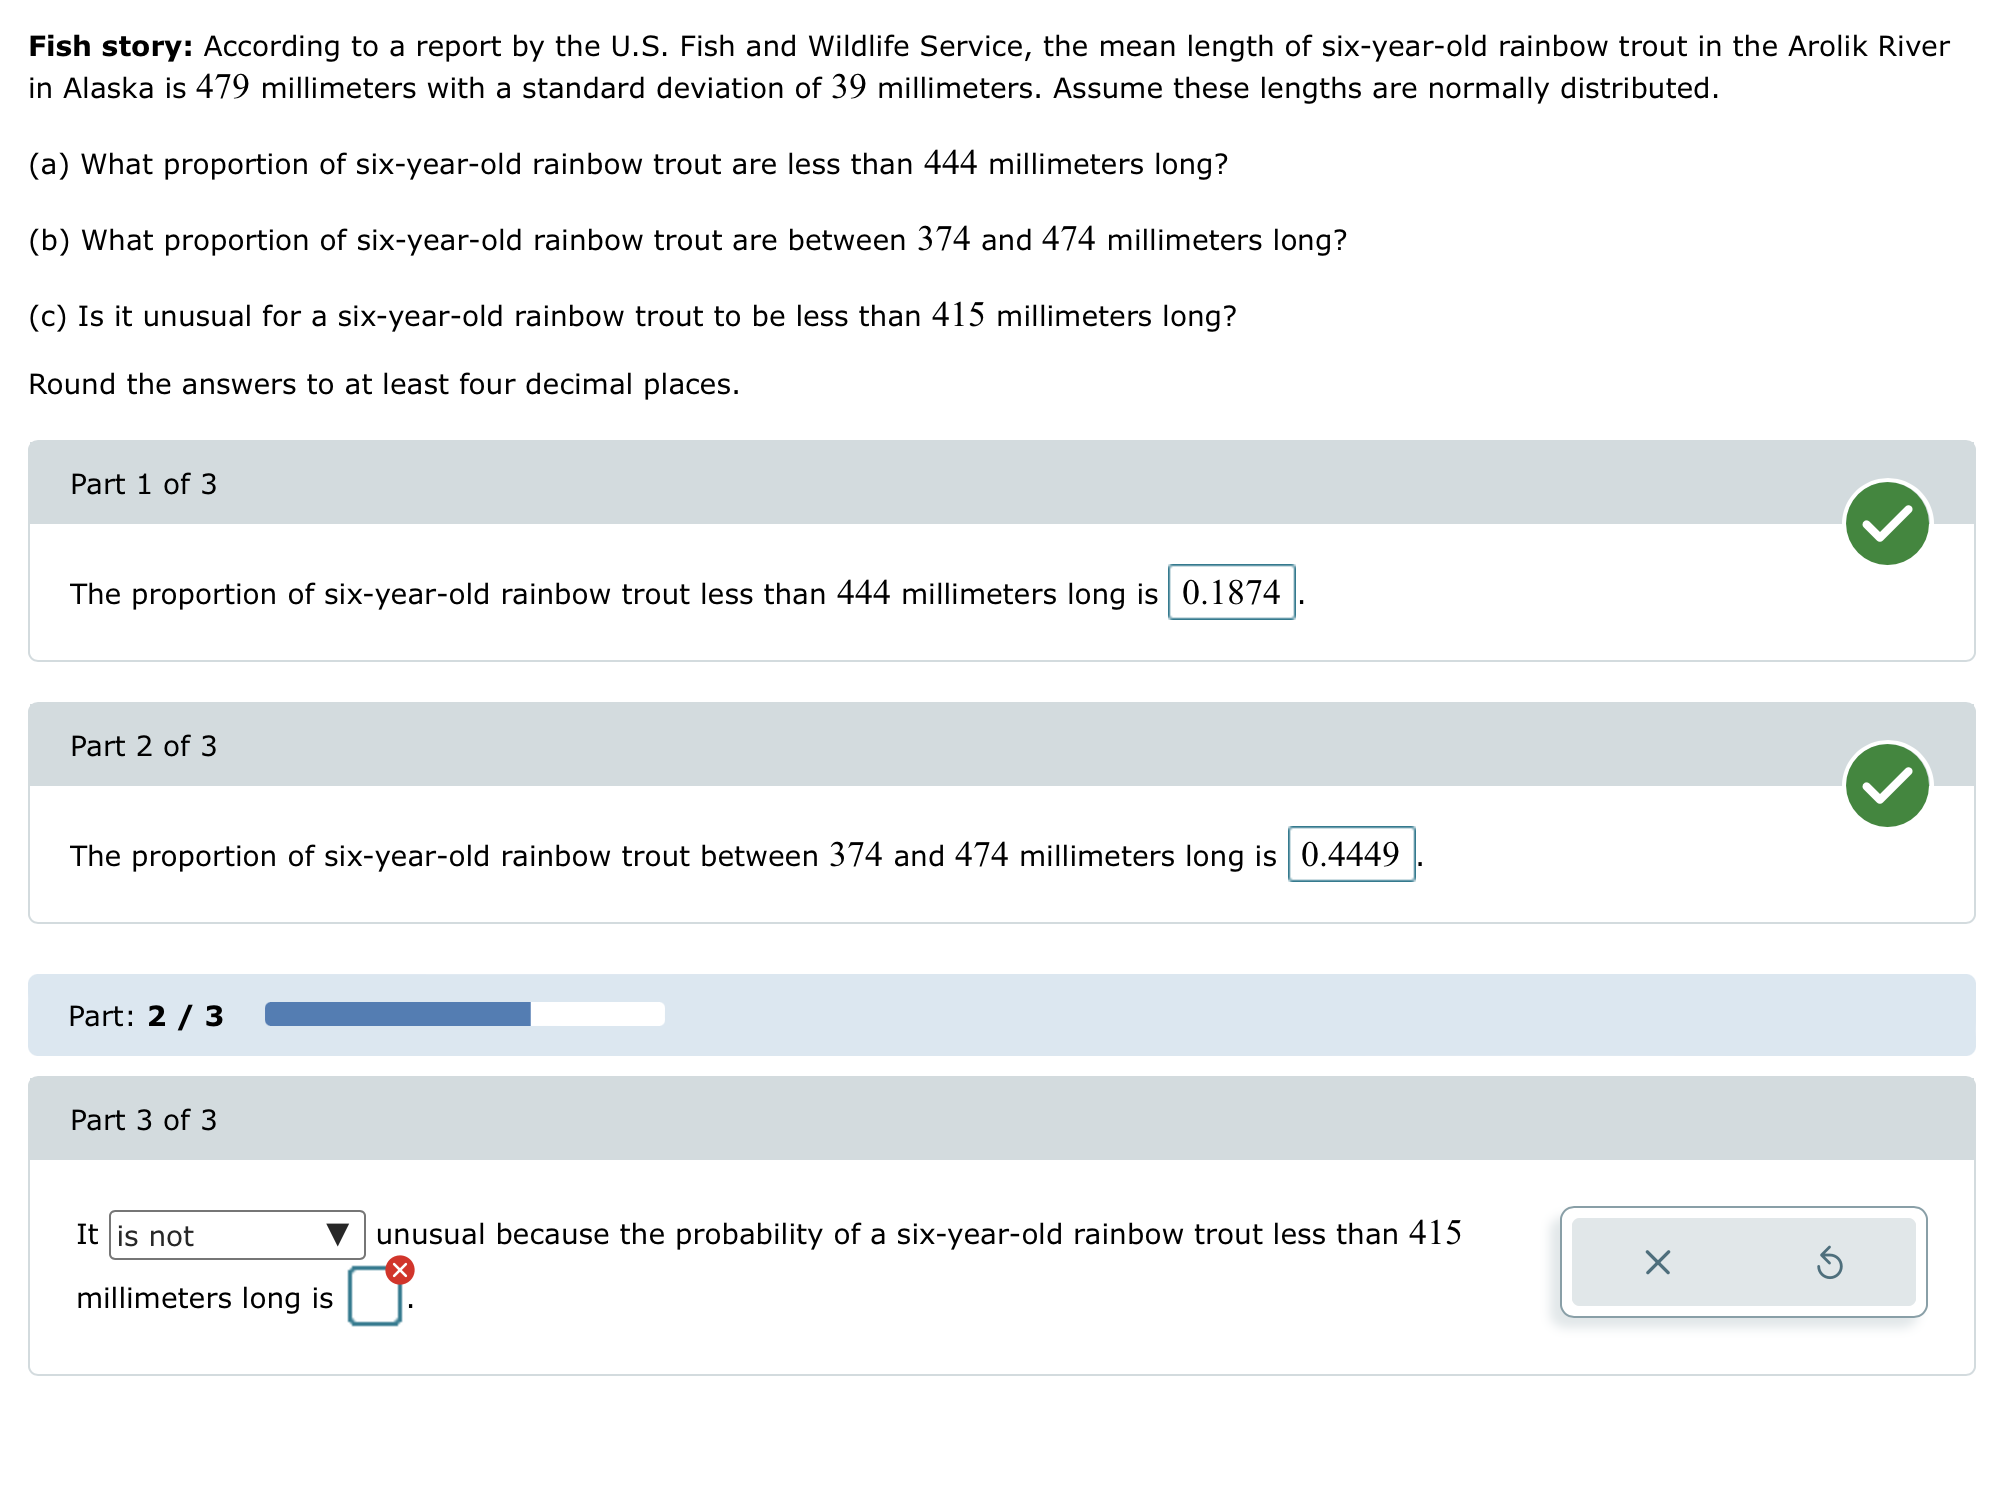
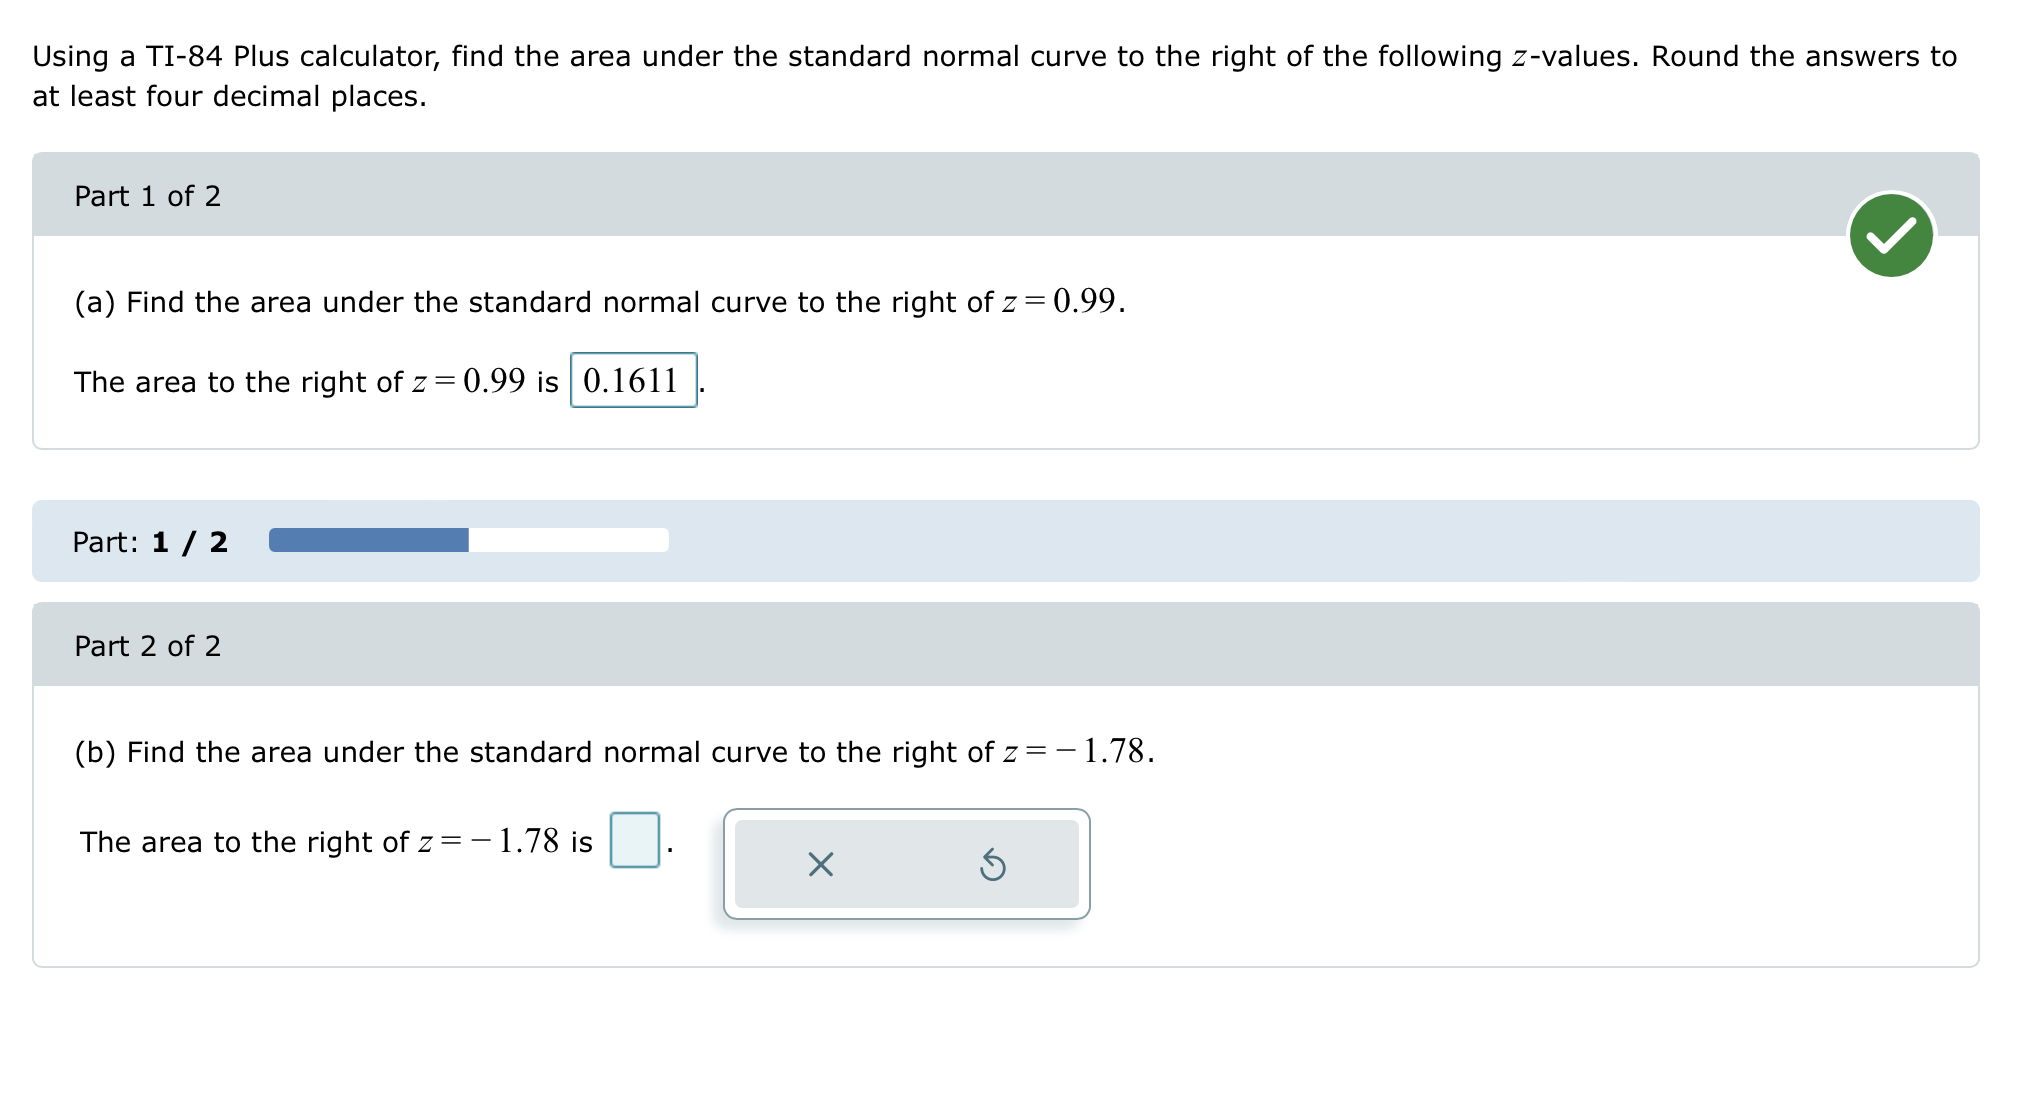
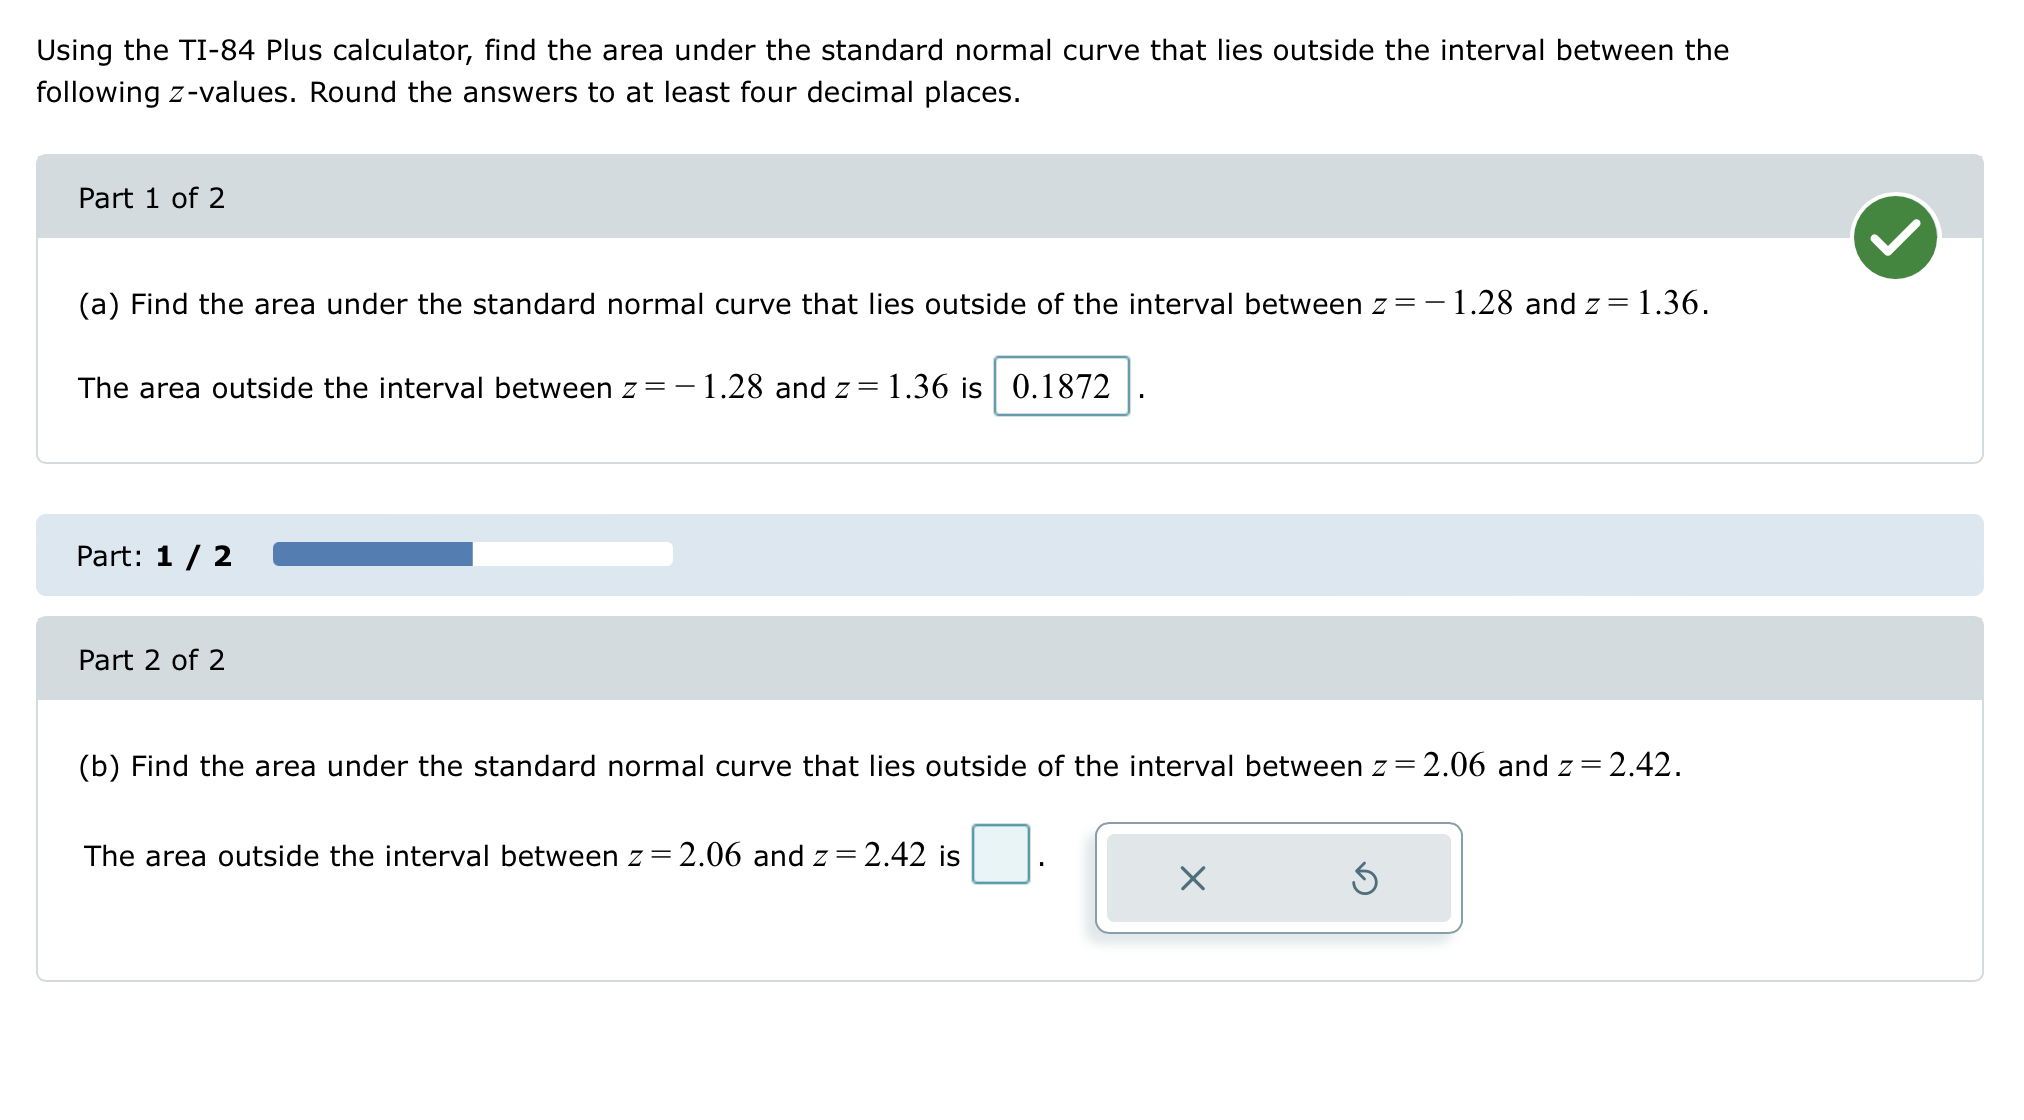
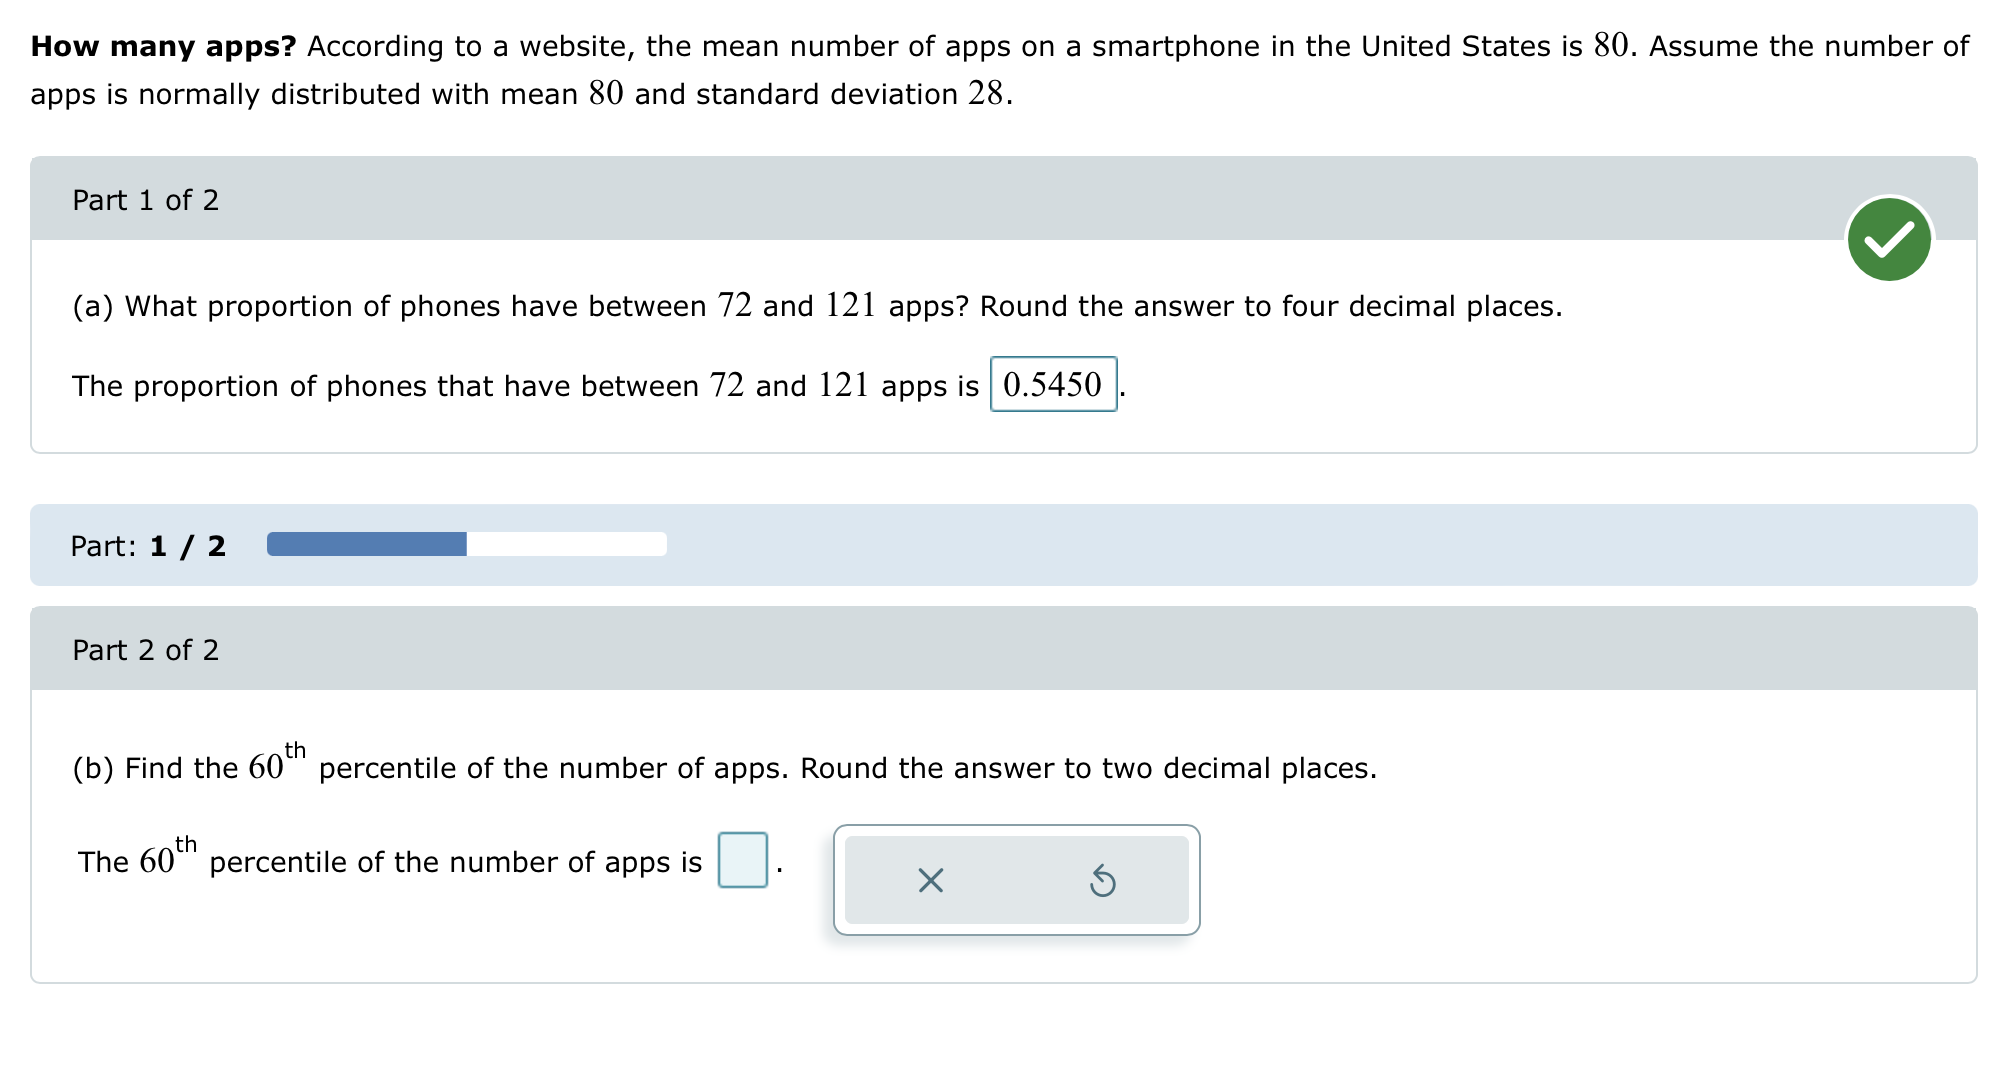
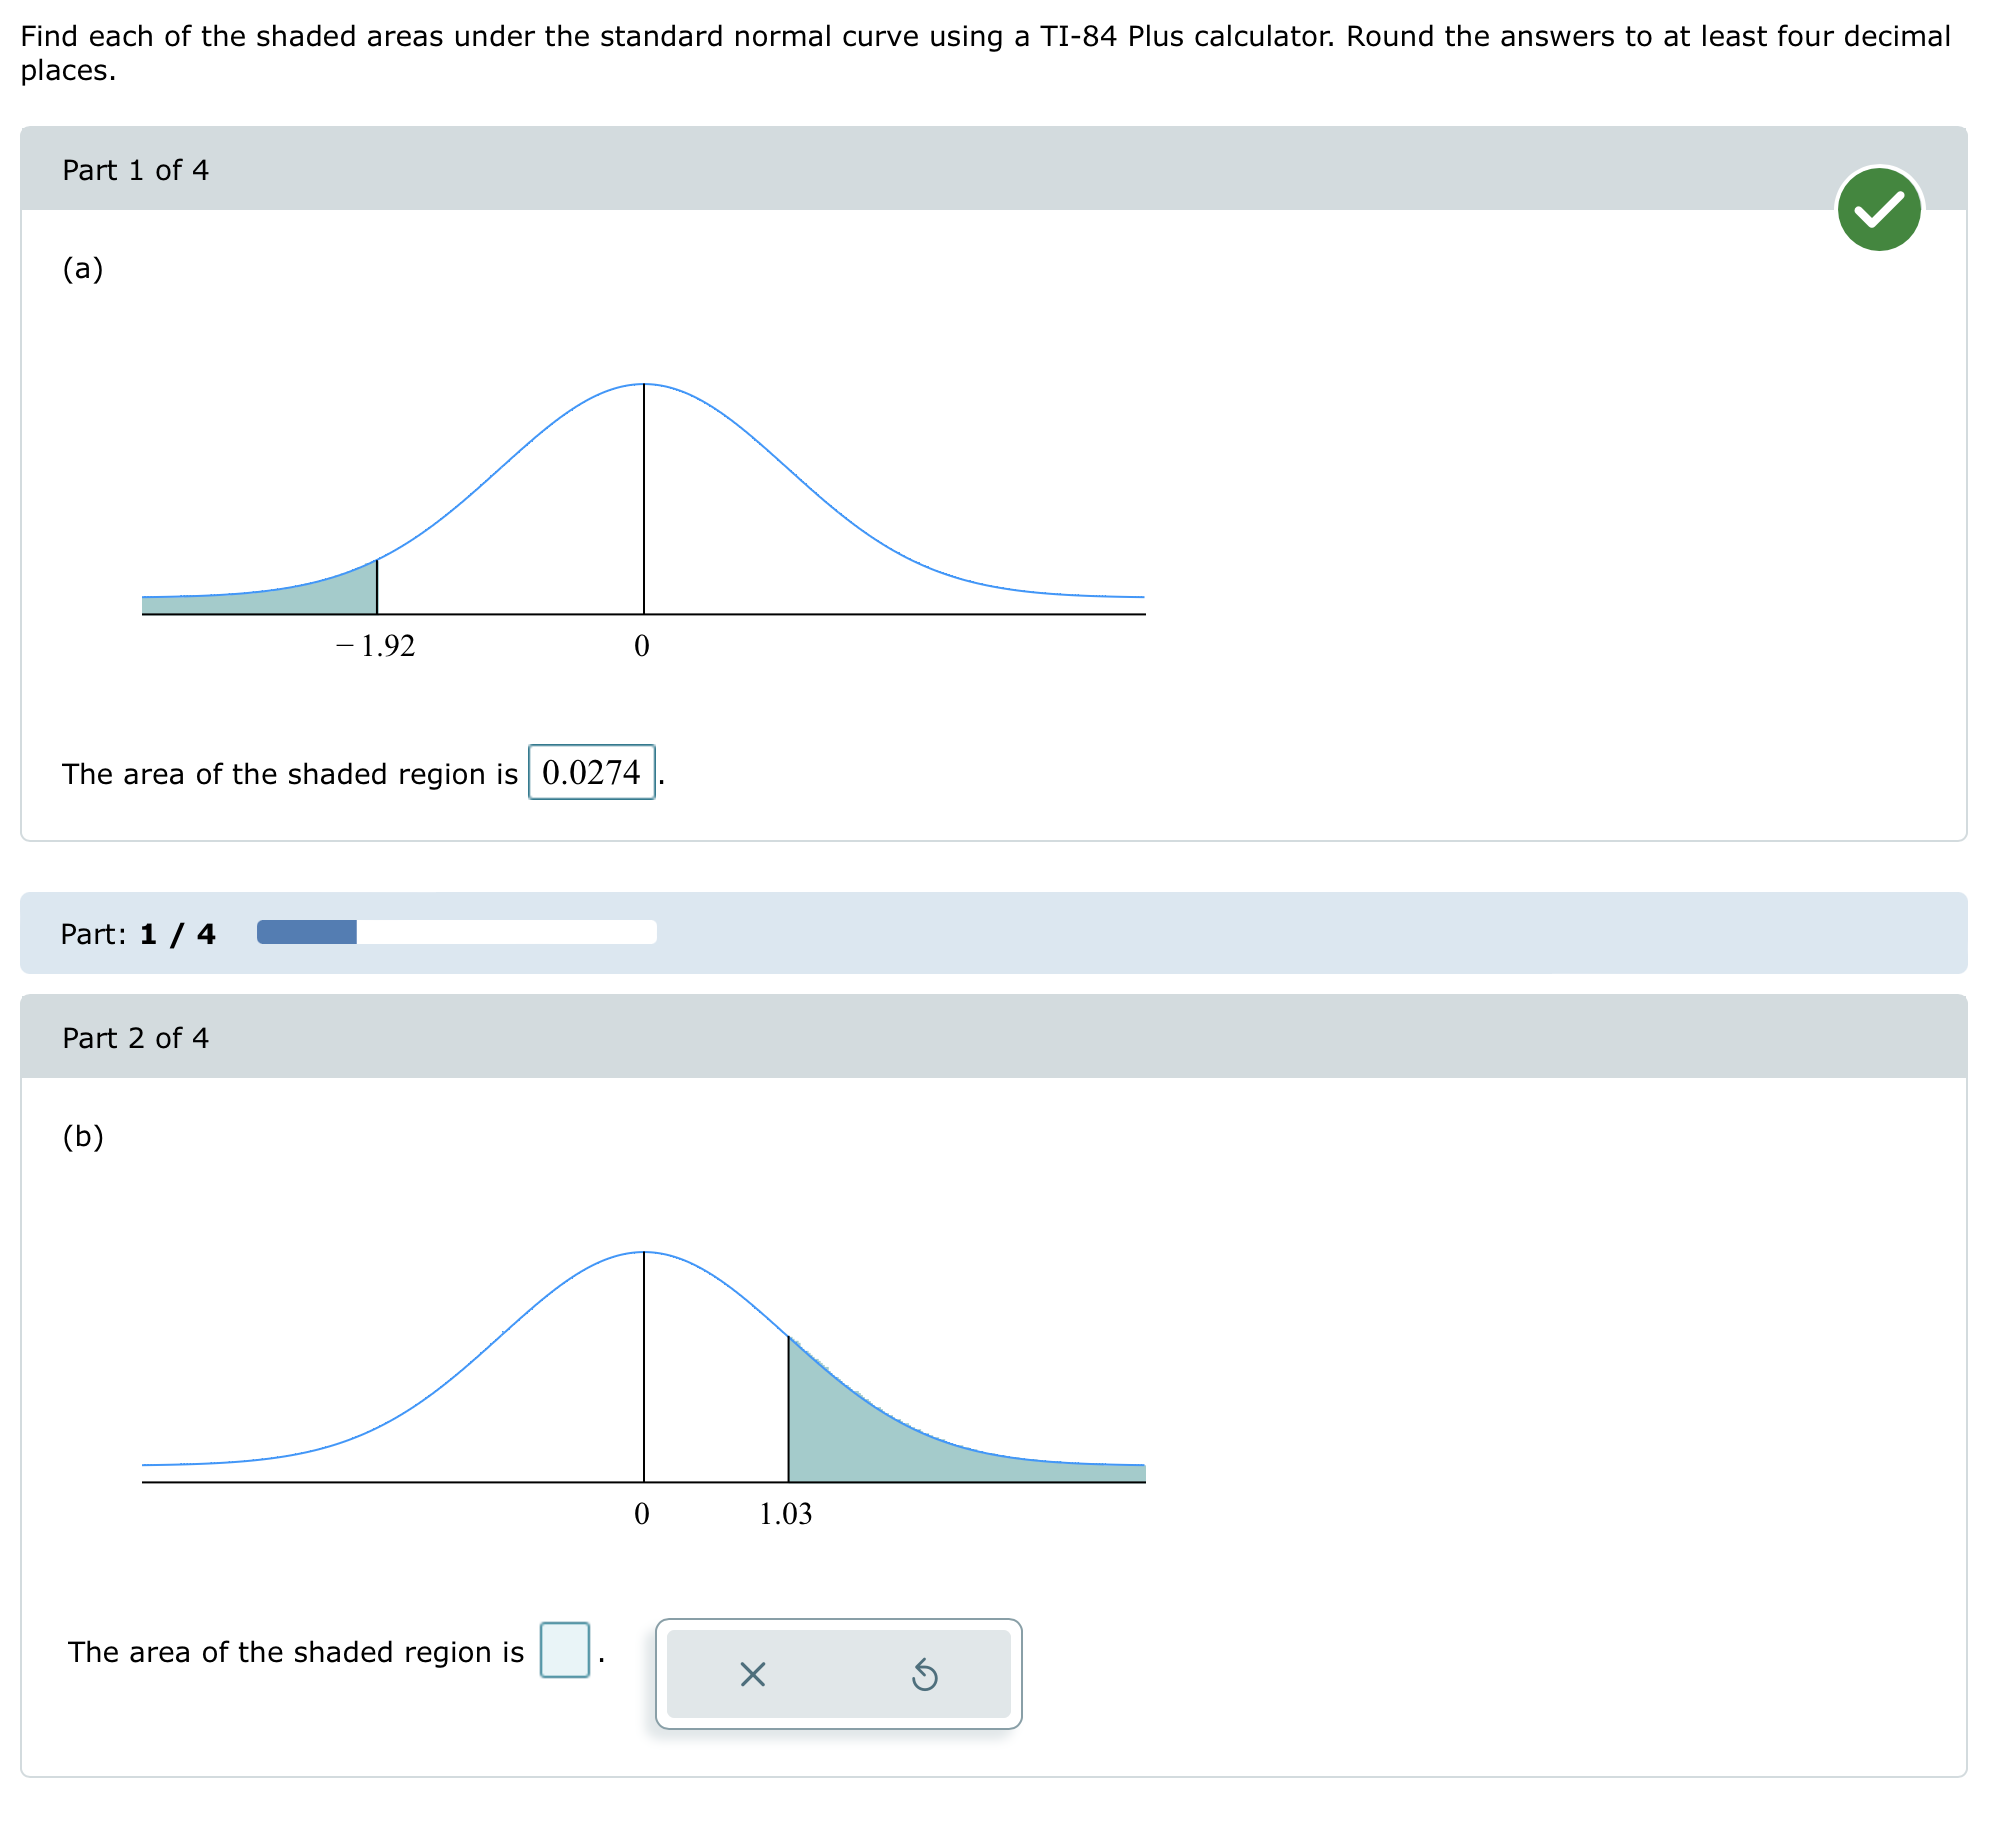
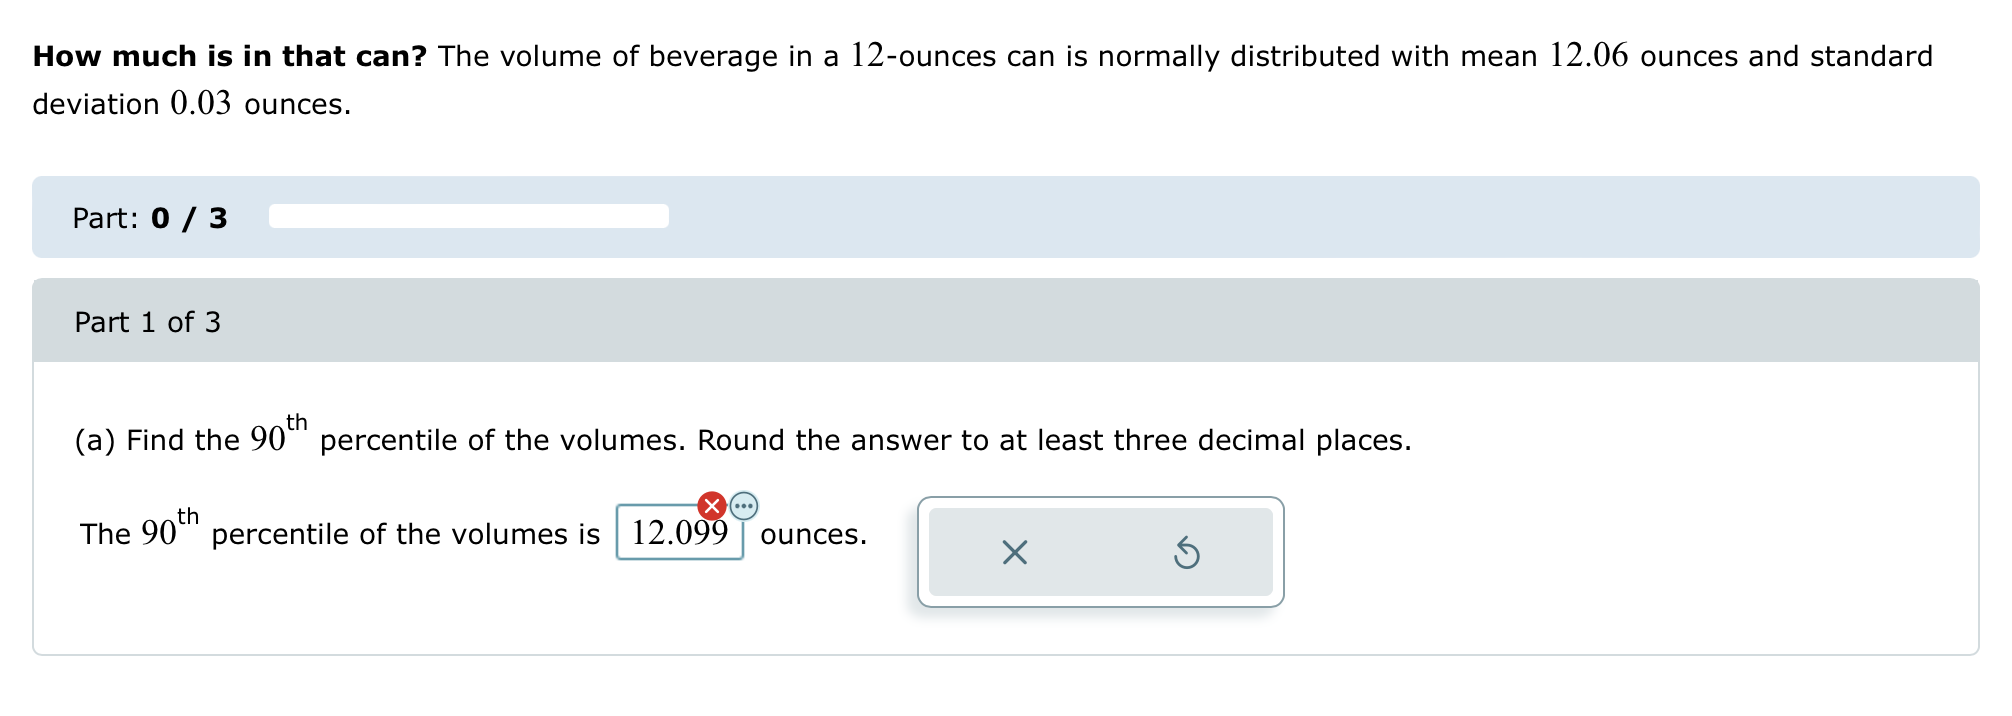
Using the TI-84 Plus calculator, find the area under the standard normal curve that lies between the following z-values. Round the answers to at least four decimal places. PaI'tIsz o (a) Find the area under the standard normal curve that lies between 2 = 1.98 and z = 0.52. The area between 2 = 1.98 and z = 0.52 is ' 0.6747 I. Part:1/2 Part2on (b) Find the area under the standard normal curve that lies between 2 = -2.45 and Z: -0.96. The area between 2 = 2.45 and z = 0.96 is ' I _ ' x 53 Fish story: According to a report by the U.S. Fish and Wildlife Service, the mean length of sixyearold rainbow trout in the Arolik River in Alaska is 479 millimeters with a standard deviation of 39 millimeters. Assume these lengths are normally distributed. (a) What proportion of sixyearold rainbow trout are less than 444 millimeters long? (b) What proportion of six-year-old rainbow trout are between 374 and 474 millimeters long? (c) Is it unusual for a sixyearold rainbow trout to be less than 415 millimeters long? Round the answers to at least four decimal places. Part 1 of3 The proportion of sixyearold rainbow trout less than 444 millimeters long isl 0.1874 I. Part Zof3 The proportion of six-year-old rainbow trout between 374 and 474 millimeters long is 1 0.4449 '. Part:2/3 Part 3 of3 It unusual because the probability of a six-year-old rainbow trout less than 415 X 63 millimeters long is [j Using a TI-84 Plus calculator, find the area under the standard normal curve to the right of the following z-values. Round the answers to at least four decimal places. Part 1 of 2 (a) Find the area under the standard normal curve to the right of z = 0.99. The area to the right of z = 0.99 is |0.1611 Part: 1 / 2 Part 2 of 2 (b) Find the area under the standard normal curve to the right of z = - 1.78. The area to the right of z = - 1.78 is XUsing the TI84 Plus calculator, find the area under the standard normal curve that lies outside the interval between the following zvalues. Round the answers to at least four decimal places. Partlon o (a) Find the area under the standard normal curve that lies outside of the interval between 2 = 1.28 and z = 1.36. The area outside the interval between 7.: - 1.28 and z= 1.36 is 1 0.1872 l. Part:1/2 Part 2on (b) Find the area under the standard normal curve that lies outside of the interval between 2 = 2.06 and z = 2.42. The area outside the interval between 2 = 2.06 and z = 2.42 is ' I. X E) How many apps? According to a website, the mean number of apps on a smartphone in the United States is 80. Assume the number of apps is normally distributed with mean 80 and standard deviation 28. Partlofz o (a) What proportion of phones have between 72 and 121 apps? Round the answer to four decimal places. The proportion of phones that have between 72 and 121 apps is I 0.5450 '. Part:1/2 Part 2on h (b) Find the 60t percentile of the number of apps. Round the answer to two decimal places. The 60th percentile of the number of apps is ' I. X 63 Find each of the shaded areas under the standard normal curve using a TI-84 Plus calculator. Round the answers to at least four decimal places. Part 1 of4 (a) 71.92 O The area of the shaded region isI 00274 I. Part: 1/4 _ Part20f4 (b) 0 1.03 The area of the shaded region is I I. How much is in that can? The volume of beverage in a 12-ounces can is normally distributed with mean 12.06 ounces and standard deviation 0.03 ounces. Part: 0 / 3 Part 1 of 3 (a) Find the 90 percentile of the volumes. Round the answer to at least three decimal places. X.. The 90" percentile of the volumes is 12.099 ounces. X 5
Step by Step Solution
There are 3 Steps involved in it

Get step-by-step solutions from verified subject matter experts