

Question: hello! I need step by steps on how to finish a type of questions like this:) thank you Problem A (Ch 7 - Cross over
hello! I need step by steps on how to finish a type of questions like this:) thank you
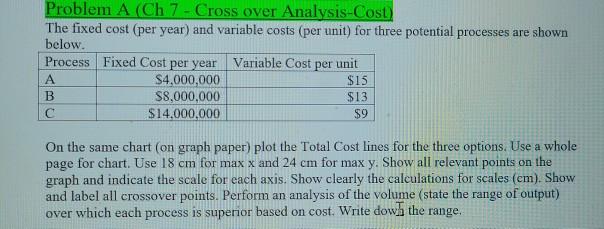
Problem A (Ch 7 - Cross over Analysis-Cost) The fixed cost (per year) and variable costs (per unit) for three potential processes are shown below. Process Fixed Cost per year Variable Cost per unit A $4,000,000 $15 B $8,000,000 $13 $14,000,000 $9 On the same chart (on graph paper) plot the Total Cost lines for the three options. Use a whole page for chart. Use 18 cm for max x and 24 cm for max y. Show all relevant points on the graph and indicate the scale for each axis. Show clearly the calculations for scales (cm). Show and label all crossover points. Perform an analysis of the volume (state the range of output) over which each process is superior based on cost.Write dow) the rangeStep by Step Solution
There are 3 Steps involved in it
1 Expert Approved Answer
Step: 1 Unlock

Question Has Been Solved by an Expert!
Get step-by-step solutions from verified subject matter experts
Step: 2 Unlock
Step: 3 Unlock