

Question: Hello, I only received partial credit for this. Question 2 The table below shows the life expectancy for an individual born in the United States
Hello, I only received partial credit for this.
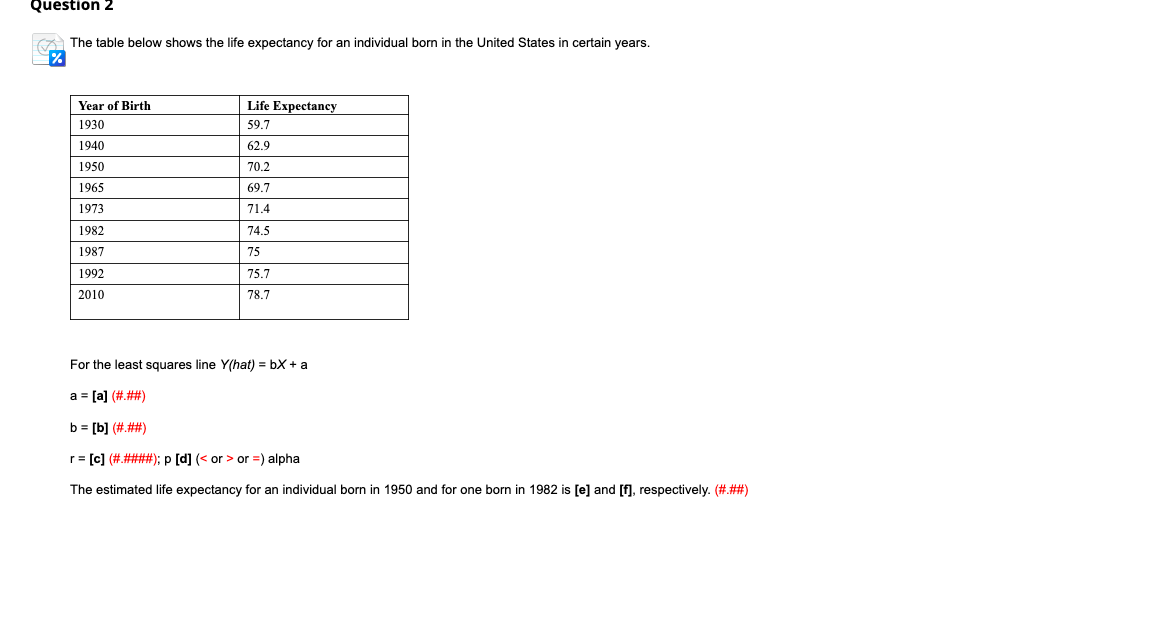
Question 2 The table below shows the life expectancy for an individual born in the United States in certain years. % Year of Birth Life Expectancy 1930 59.7 1940 62.9 1950 70.2 1965 69.7 1973 71.4 1982 74.5 1987 75 1992 75.7 2010 78.7 For the least squares line Y(hat) = bX + a a = [a] (#.##) b = [b] (#.##) r = [c] (#.####); p [d] ( or =) alpha The estimated life expectancy for an individual born in 1950 and for one born in 1982 is [e] and [f], respectively. (#.##)
Step by Step Solution
There are 3 Steps involved in it
1 Expert Approved Answer
Step: 1 Unlock

Question Has Been Solved by an Expert!
Get step-by-step solutions from verified subject matter experts
Step: 2 Unlock
Step: 3 Unlock