

Question: Hello, I really need help I've been trying to project but my teacher keeps on giving me 0. I found one on the website but
Hello,
I really need help I've been trying to project but my teacher keeps on giving me 0. I found one on the website but i cant copy it or she will know. Can you please do it for me ill attach the document on what it is. i cant upload it but its called this: MCR3U Culminating Project (3 hours, 10%) here are instructions: Instructions
Google Trendsis an online tool that allows a user to search the global interest of a "search-term" over time. The y-axis shows the relative number of searches and the x-axis shows time (the scale can be changed).
SETTING UP - USING GOOGLE TRENDS AND DESMOS
The following instructions can also be found in video formathere.
1. Select of an example of a real-world "search-term" of interest to you that would produce an "interest over time" graph.State your search term in bold at the top of your submission.Aim to find a trend that produces a graph that appears to includeas many functions that you have learned about in this course as possible.
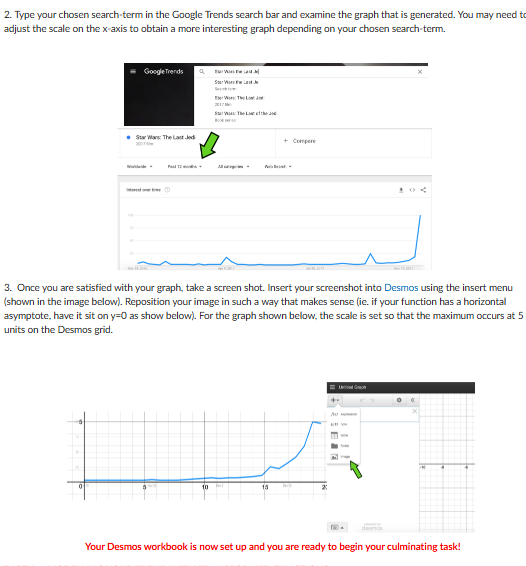
2. chosen search-term in the Google Trends search barand examine the graph that is generated. You may need to adjust the scale on the x-axis to obtain a more interesting graph depending on your chosen search-term.
3. Once you are satisfied with your graph, take a screen shot. Insert your screenshot intoDesmosusing the insert menu (shown in the image below). Reposition your image in such a way that makes sense (ie. if your function has a horizontal asymptote, have it sit on y=0 as show below). For the graph shown below, the scale is set so that the maximum occurs at 5 units on the Desmos grid.
Your Desmos workbook is now set up and you are ready to begin your culminating task!
PART A - MODELLING YOUR TREND WITH TRANSFORMED FUNCTIONS
An example can be foundhere.
Using your Desmos workbook, begin plotting base functions and transforming them to model your trend. by starting with an appropriate base function (ie. y = 2x) and applying your understanding of transformations. See the link above for assistance with this.
Remember: your goal is to include as many function types from this course as possible.
Apply your transformations one at a time. Your goal is to show your progress as you develop your model. When you have successfully modelled your entire trend, be sure toinclude one final labelled screenshot.
PART B - ANALYSIS OF YOUR TREND
You now have amodelthat relates the interest level of your search-term (y-axis) to the date (x-axis).
Question #1 - Reflecting on the Model
- Describe the thinking you used in order to ensure your model matched the search-term. What types of functions did you include to model your Google Trend search-term and why?
Question #2 - Accuracy of the Model
- Compare the resulting graph of your model to the search-term trend in three different places on the graph. How accurate is your model in each of these places?
- If your graph were to continue, what do you believe the trend would look like? Can you be certain? Why or why not?
- Would you use your model to make predictions about your search term? Justify your response.
Question #3 - Reflecting on the Real-World Context
- Describe what was going on in the world with respect to your search-term at the significant points on your graph (ie. maximum points, points of major fluctuation, points where the shape changes significantly).
CHECKLIST FOR SUBMISSION
- Search-term is clearly indicated
- One final labelled screenshot is included showcasing the graph of the model and the search-term trend. Be sure to show all functions used.
- Answers to the analysis questions in Part B are included in an organized manner
Step by Step Solution
There are 3 Steps involved in it

Get step-by-step solutions from verified subject matter experts